

教育学习3 weeks ago
Ten Billion Years - The Life of a Star
通过交互式WebGL探索恒星从诞生到黑洞的完整生命周期。

@rotaercz · X
Built it for my son. 0 MRR but priceless to make a child happy.
完整作品展
技术栈
17 projects
通过交互式WebGL探索恒星从诞生到黑洞的完整生命周期。
@rotaercz · X
Built it for my son. 0 MRR but priceless to make a child happy.

CodeFlovio 将代码转换为交互式流程图,便于学习、调试和文档编制。

@Sparsh209 · X
Hi isha! Check it out here at: Would love to hear your feedbacks
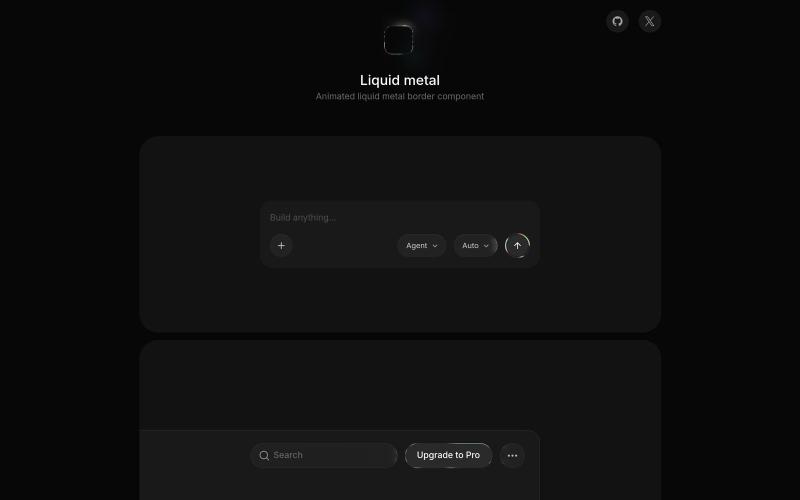
为UI组件创建液态金属效果的实时WebGL着色器。

@MengTo · X
These will instantly make your vibe-coded projects look less generic. Free, open-source libraries from the same creator: • • •
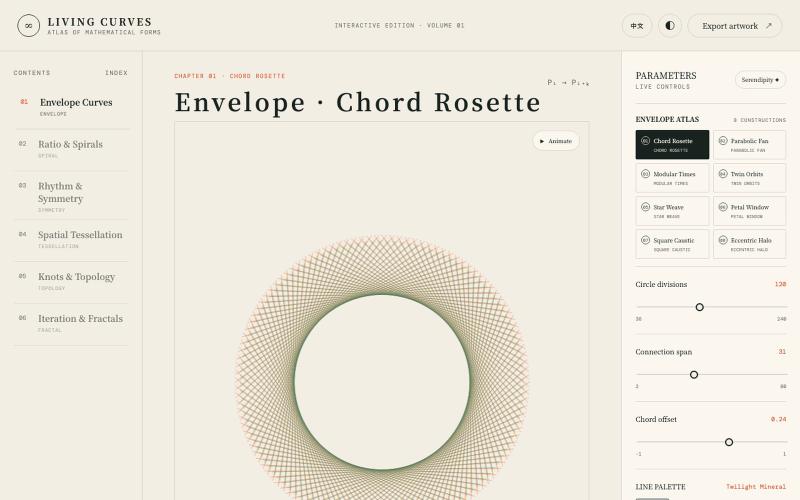
探索数学曲线、分形、对称和拓扑的交互式可视化。

@vkuoo · X
Added more demos showcasing graph-math relationships, built with Codex.

React 和 shadcn/ui components,用于在营销和登陆页面上创建 animated visual elements

@pixelcave_john · X
Hey Germán! I recently launched and a major update to Tailkit!
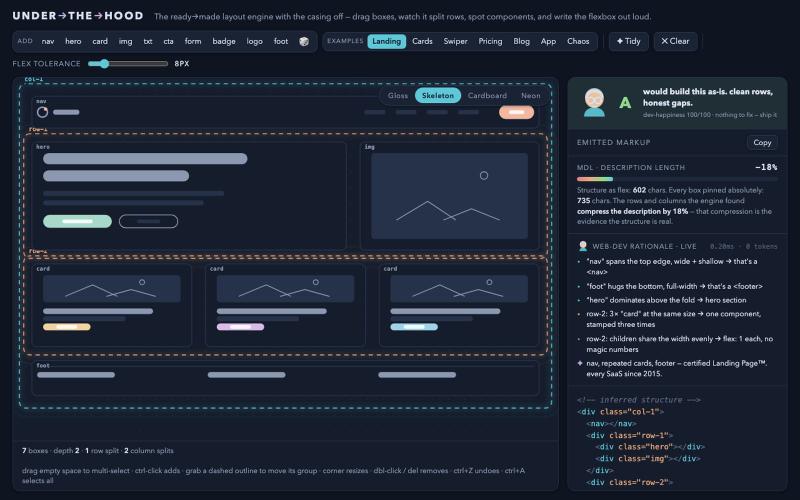
拖动方框体验Flexbox布局引擎的推断过程。
drzivil · HN
Drag boxes around and watch a layout engine infer the Flexbox (no AI)
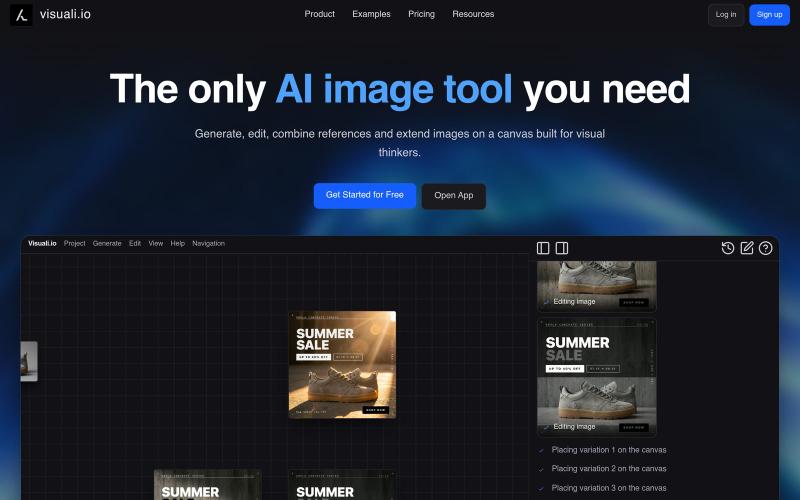
AI 图像编辑与生成工具,在浏览器和移动设备上编辑和扩展图像。
visuali · HN
Like Claude Code for Images

LSBattle实时展示BTC/ETH/SOL期货市场多空战场可视化。
flreey · V2EX
模拟 btc/eth/sol 多空军沙盘效果 https://w3arb.xyz/ 其他地方看到的创意,我觉得很有意思,模拟币圈多军/空军对战场景 底部还可以发弹幕,聊天
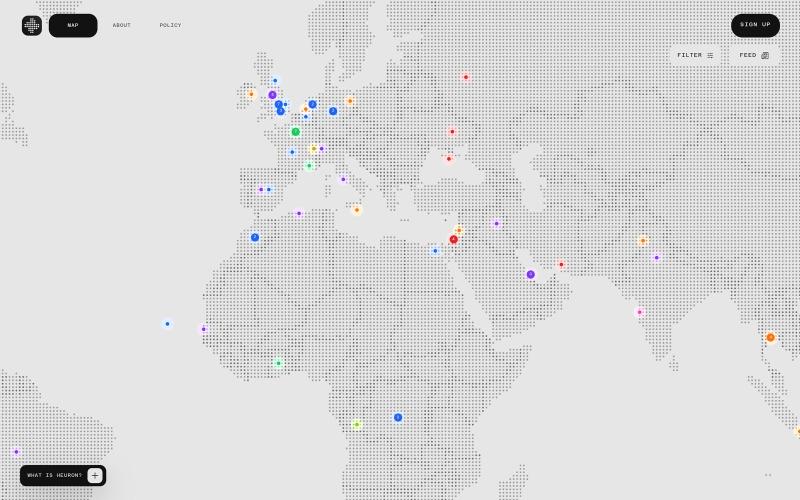
通过可视化、感知来源的新闻地图探索全球事件。

@brryg_ · X
sure man, working on a social and visual news hub called heuron - lmk what you think!

用 AI 从文本故事创建网络漫画和漫画,支持多种艺术风格和 4K 导出。
StarVeil AI - 星河入梦 — 使用AI生成连续漫画的网站
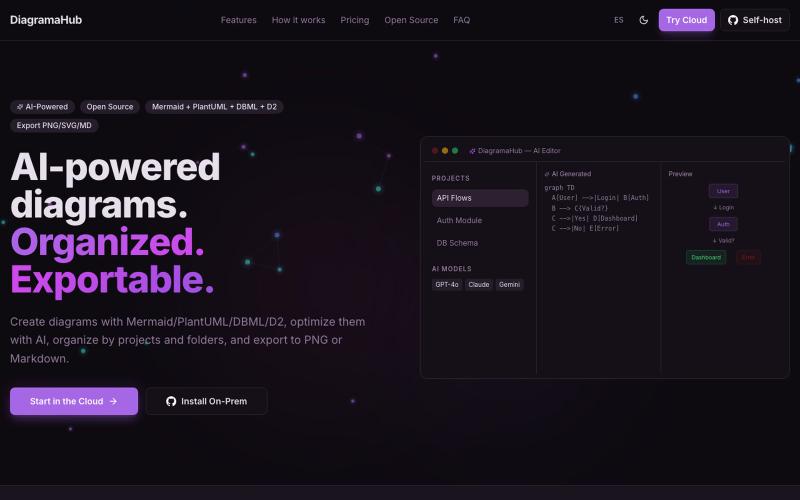
用文字创建和导出图表,支持 Mermaid、PlantUML、D2 等格式。

@soyalexdzul · X
Open-source platform for creating, organizing, and exporting diagrams using plain text markup. It combines the power of Mermaid, PlantUML, and D2 with a polished interface
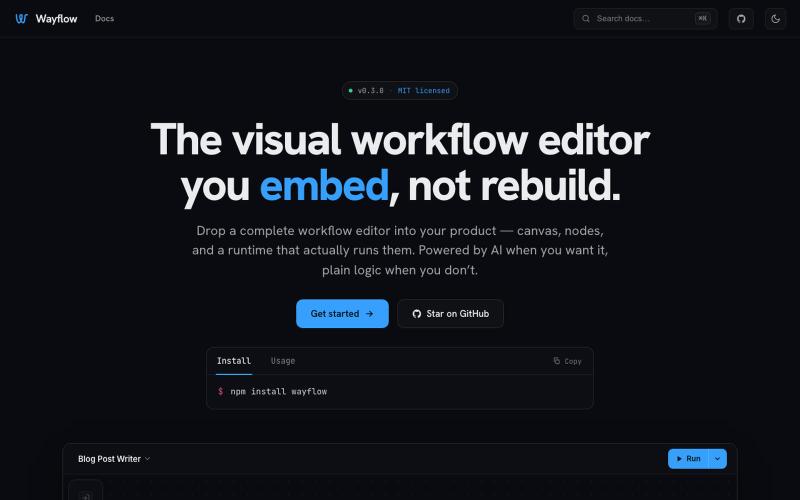
可嵌入的可视化工作流编辑器,支持AI驱动或纯逻辑设计。
tahazsh · HN
Hi! I’m Taha. In many agentic products that support workflows (including one I worked on), I noticed they either don’t support node-based editors, or use React Flow and go through the difficult work of integrating it into their product to run it and work with their existing logic. So I thought about creating a tool that could help with this by closing the gap between the editor and the runtime. That’s why I created Wayflow. The basic architecture is simple: you just need to create a graph (which is a JSON object) that the runtime knows how to run. The runtime doesn’t care where that graph is coming from, it just needs the right schema. And with the help of the editor, you can create the graph, and then export it or directly save it on your backend in your database. And then when you want to execute it, you just hand it to the runtime. The runtime can either stream the execution (which is useful for the editor), or give you the final result. How you execute the graph is up to you: t