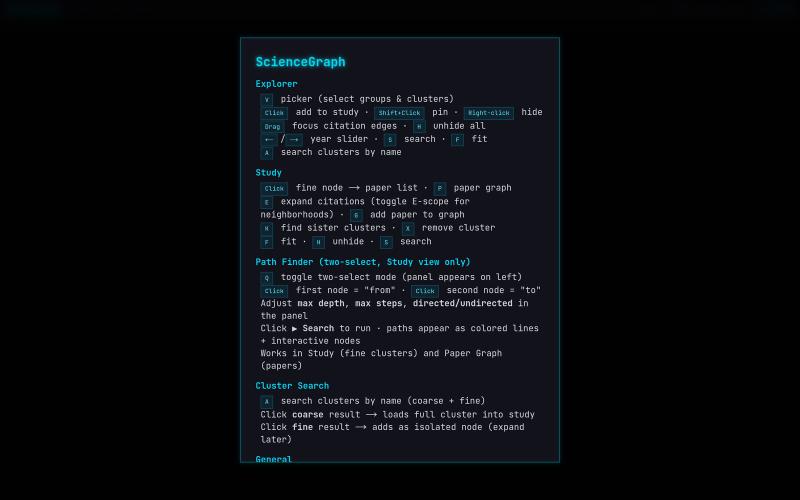
ScienceGraph — Citation Map Explorer
科学引文网络与论文的交互式WebGL可视化。
@lushptr · X
I feel really guilty for vibe coding this but it looks cool even tho it is really inefficient and broken you can use it too now I'll desloppify it after exams I swear
完整作品展
技术栈
60 projects

科学引文网络与论文的交互式WebGL可视化。
@lushptr · X
I feel really guilty for vibe coding this but it looks cool even tho it is really inefficient and broken you can use it too now I'll desloppify it after exams I swear

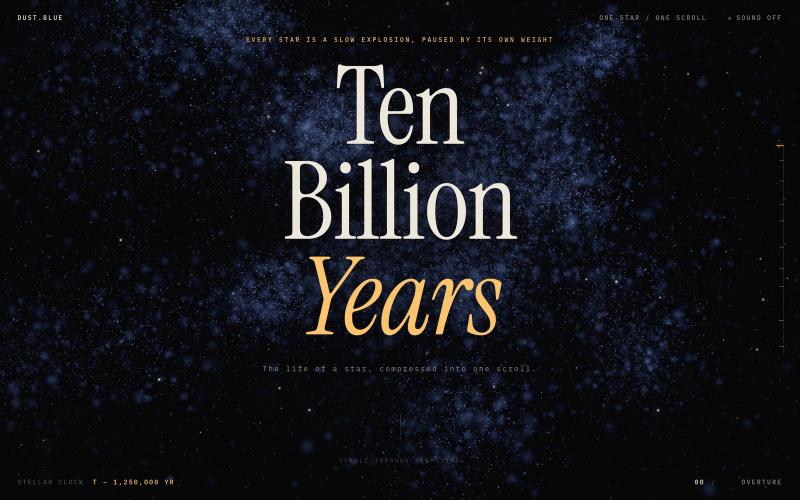
通过交互式WebGL探索恒星从诞生到黑洞的完整生命周期。
@rotaercz · X
Built it for my son. 0 MRR but priceless to make a child happy.

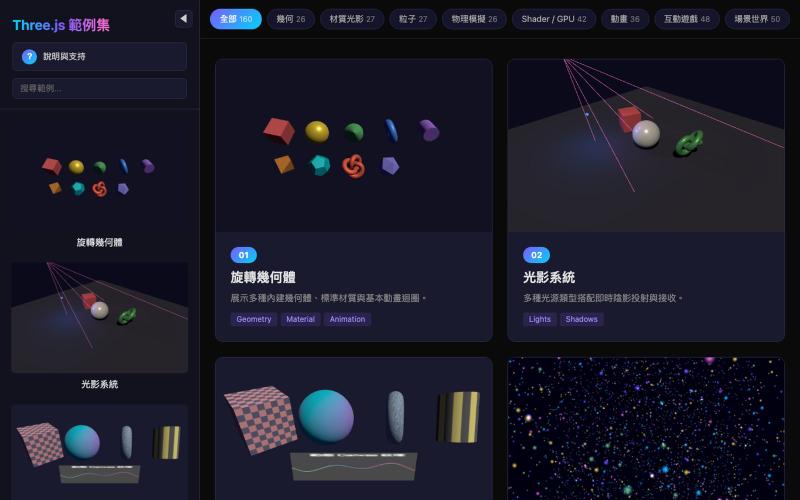
探索160个Three.js示例集合,了解3D网络图形和WebGL技术。
@maxchu2021 · X
160 Three.js examples built with Claude through vibe coding. AI didn’t replace coding—it accelerated experimentation and iteration. Next step: turning these demos into production-ready products. Link: #ThreeJS #WebGL #AI #Claude #VibeCoding

CodeFlovio 将代码转换为交互式流程图,便于学习、调试和文档编制。
@Sparsh209 · X
Hi isha! Check it out here at: Would love to hear your feedbacks

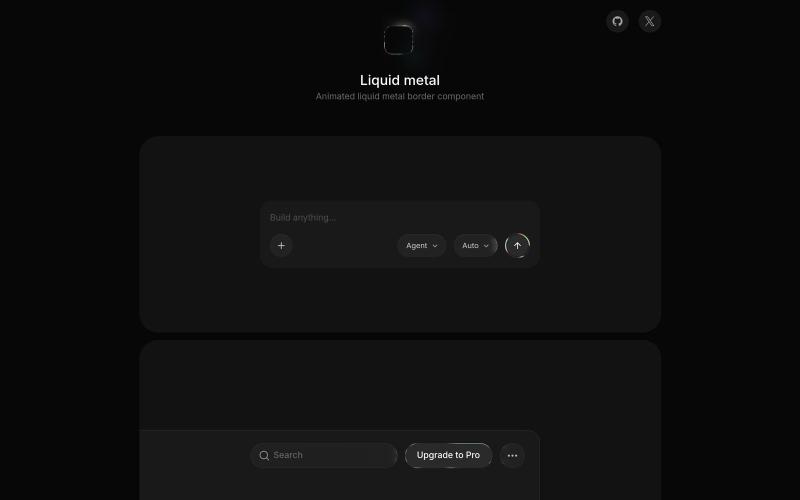
为UI组件创建液态金属效果的实时WebGL着色器。
@MengTo · X
These will instantly make your vibe-coded projects look less generic. Free, open-source libraries from the same creator: • • •

探索由参考图像程序生成的交互式Three.js 3D场景。
@zdkiel_labs · X
Started with a single image. Ended with an interactive Three.js scene. Still amazed that experiences like this run entirely in the browser. Built with img2threejs + Claude Code. Demo ↓ @threejs

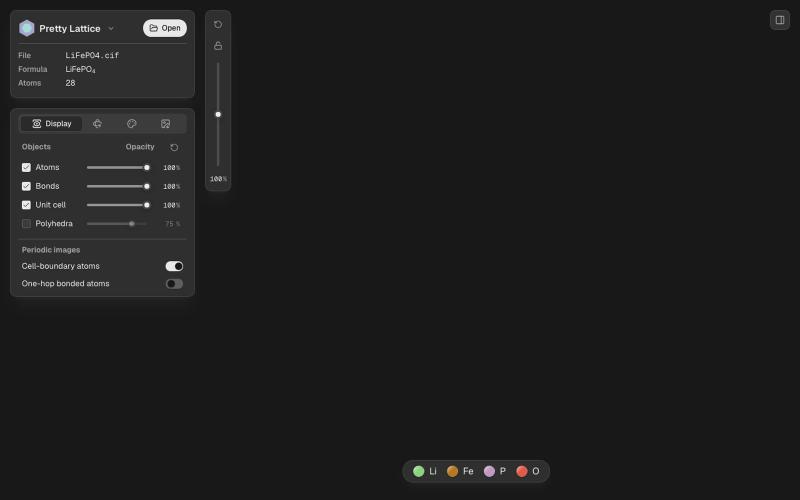
创建美丽的晶体可视化和图案。
@songfeitong · X
Introducing Pretty Lattice, a modern-looking crystal visualization tool for creating beautiful figures. Built with Codex since 5.5, and now with 5.6 sol. A huge leap from 5.5, much better at frond end. Github: Demo:

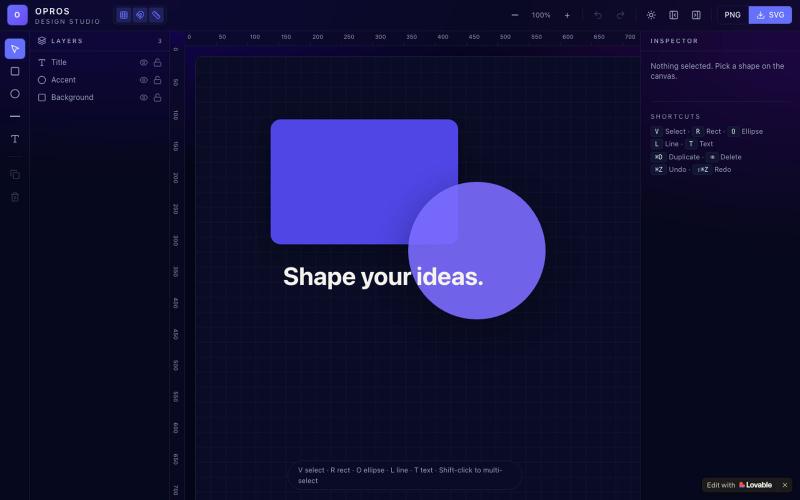
在网络上创建和可视化设计的创意工作室OPROS Design Studio。
@OprosOlamiflex · X
Check out what I just built with Lovable!

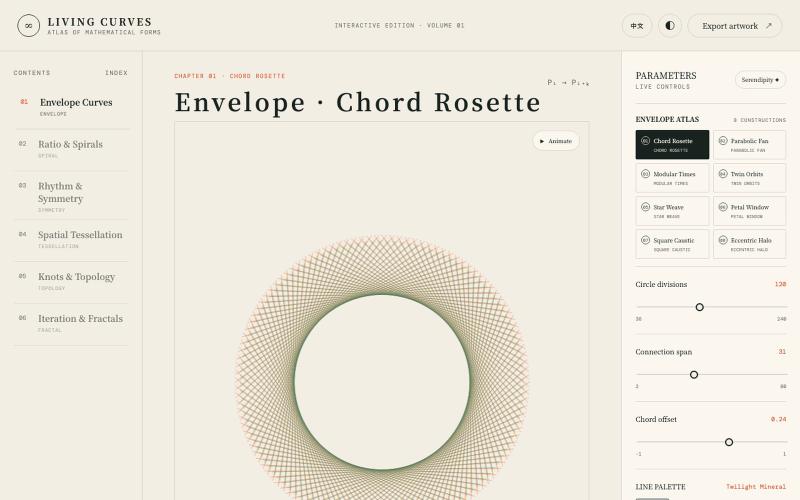
探索数学曲线、分形、对称和拓扑的交互式可视化。
@vkuoo · X
Added more demos showcasing graph-math relationships, built with Codex.

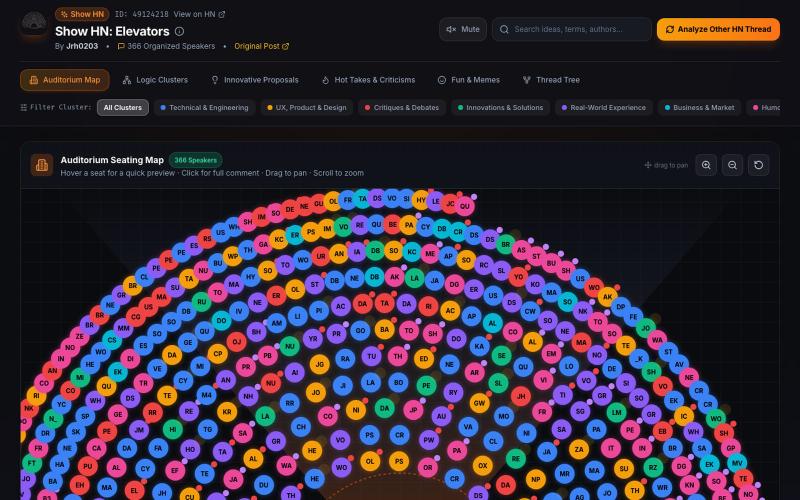
通过交互式空间可视化探索 Hacker News 讨论,使用 AI 摘要和逻辑聚类。
ahmedxuhri · HN
Postroom – HN thread 2D Visualizer as auditorium AI-powered summaries

Flint是为AI代理设计的可视化语言,用于创建交互式数据可视化。
chenglong-hn · HN
Data visualizations are the bridge between user and data. But building AI agents that can generate visualizations reliably can be very tricky: - simple chart specs can be reliable, but generated charts are often of low quality due to reliance on system defaults; - complex chart specs with explicit details can produce good-looking charts, but they are verbose and agents can struggle with reliability We figured out it is a limitation on the language issue (not just AI capability thing) -- current visualization languages are a bit too low-level for AI agents, requiring them to explicitly make visual decisions that are supposed to be handled by a good compiler. Flint is a visualization intermediate language to address this issue, allow AI agents to solve this last-mile human-agent interaction problem. It provides a simple semantic-type based specification, and contains a layout optimization engine that can produce good-looking charts (filled with derived low-level details) from simple

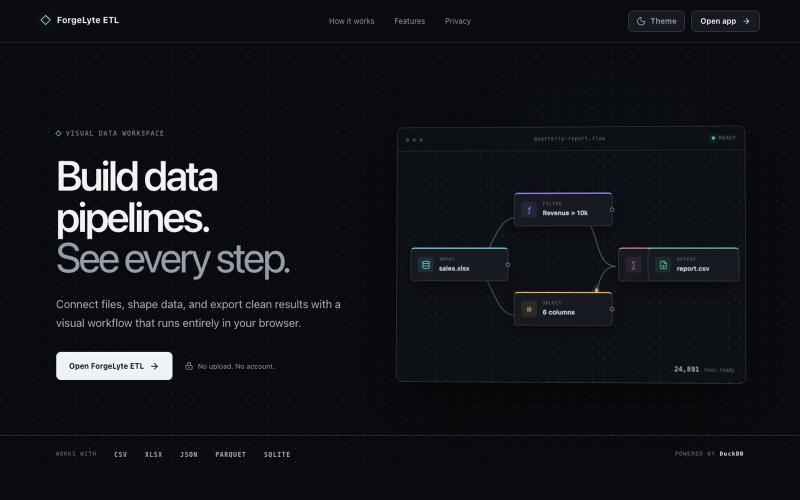
为 CSV、Excel、JSON 和 Parquet 文件创建可视化数据 ETL 管道。
@ashkans_dev · X
An ETL tool: