
Education1 month ago
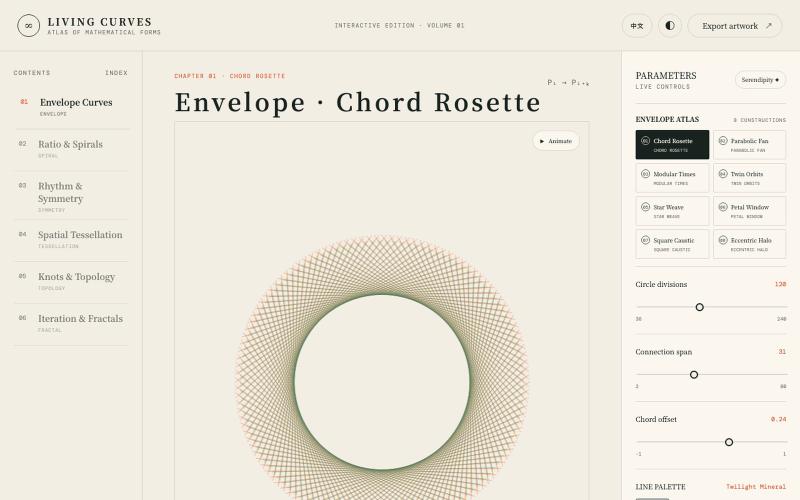
Atlas of Living Curves
Explore interactive visualizations of mathematical curves, fractals, symmetry, and topology.

@vkuoo · X
Added more demos showcasing graph-math relationships, built with Codex.
The full gallery
Tech stack
60 projects
Explore interactive visualizations of mathematical curves, fractals, symmetry, and topology.
@vkuoo · X
Added more demos showcasing graph-math relationships, built with Codex.
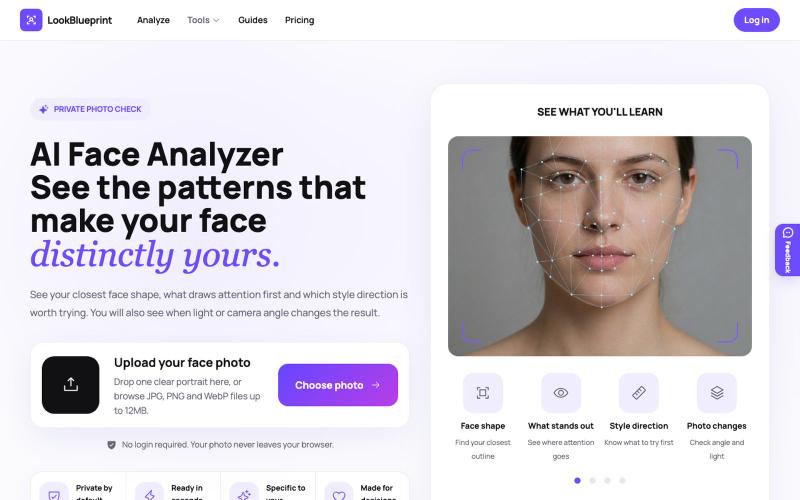
Upload a photo to analyze your face shape, symmetry, proportions, and jawline using AI.
nuco · HN
AI Face Analyzer
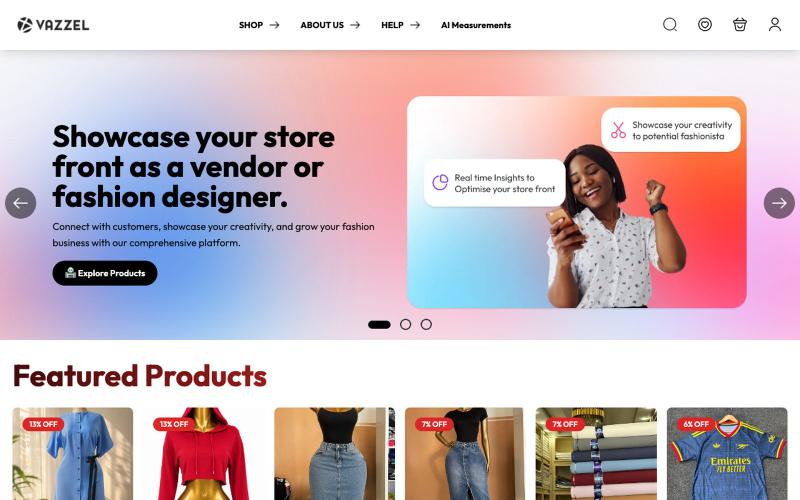
AI-powered fashion marketplace with designer storefronts and AI body measurement features.

@TeamVazzel · X
Vazzel is an AI-powered fashion & lifestyle marketplace where designers and vendors launch virtual storefronts, while shoppers enjoy AI body measurements and secure payments. Live with 500+ users and scaling
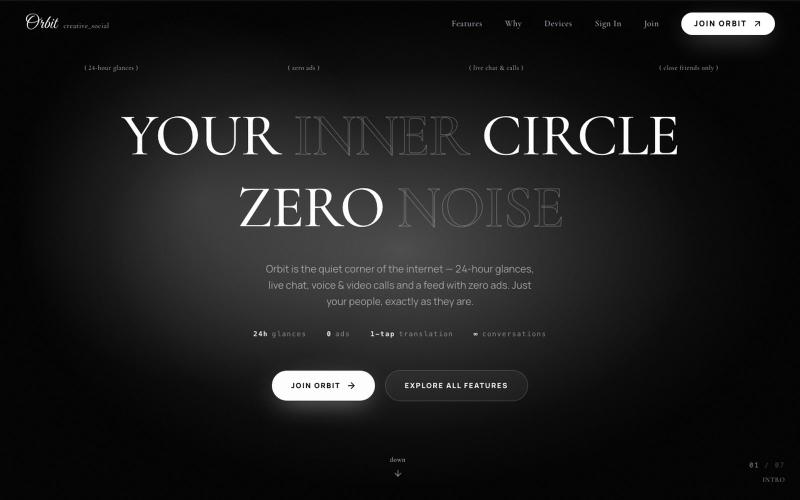
A social platform for sharing content and chatting with your inner circle.

@indieDev_ut · X
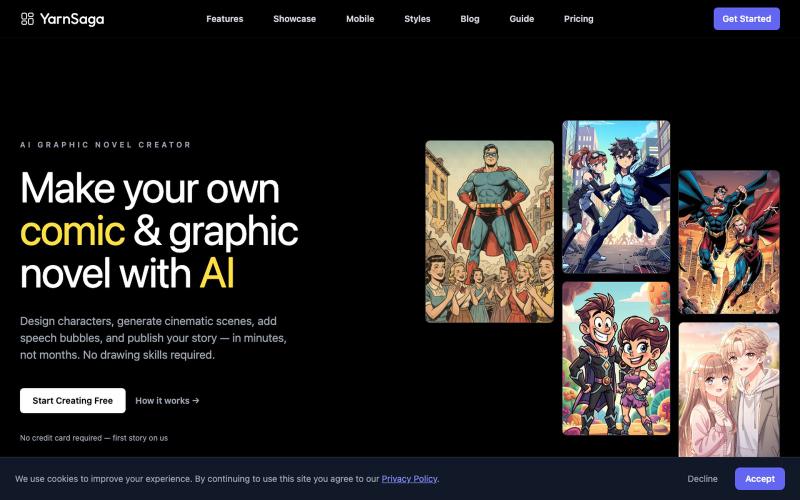
Design and publish AI-generated comics with consistent characters in multiple styles.

@yarnsaga · X
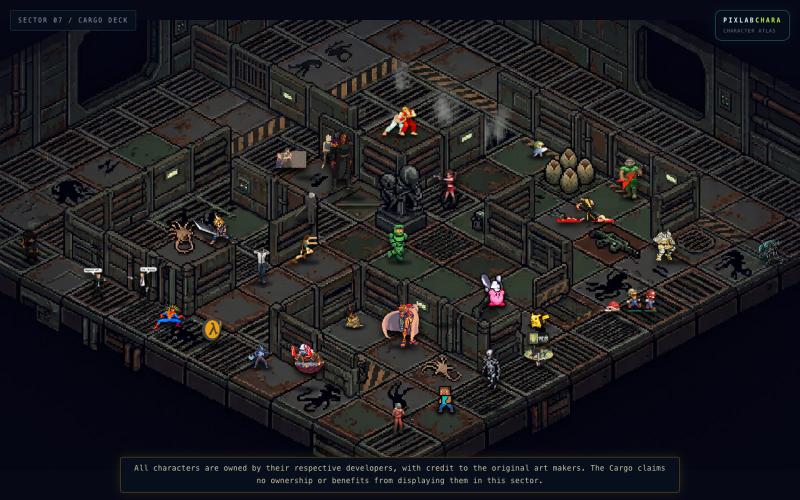
Explore a living pixel-art character atlas inside an isometric cargo arena.

@deducationsol · X
Built Pixlab Charaa. It's up on the @KrackedDevs showcase: production : #buildinpublic #vibecoding #pixart #showcase #hobby
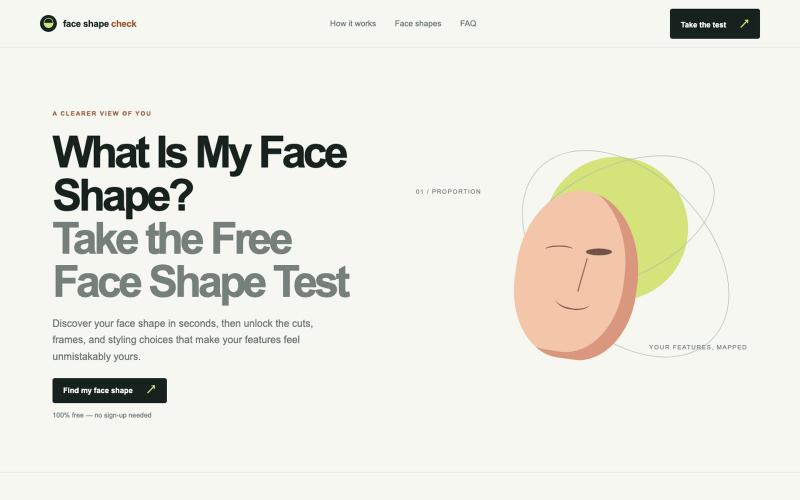
Upload a photo and instantly find out your face shape — oval, round, square, heart, diamond or oblong. Free AI face shape test with hairstyle & glasses recommendations.

@red_bear888 · X
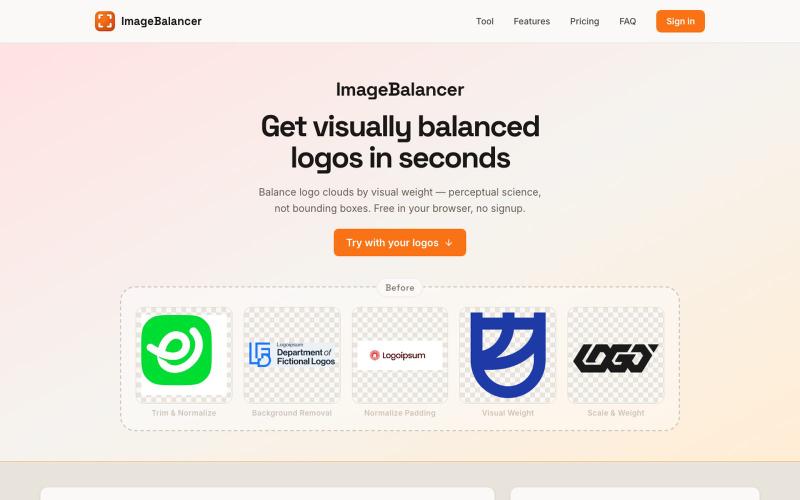
Balance images and logo clouds by visual weight using perceptual science — not bounding boxes. Free in your browser, no signup.

@MarkPraschan · X
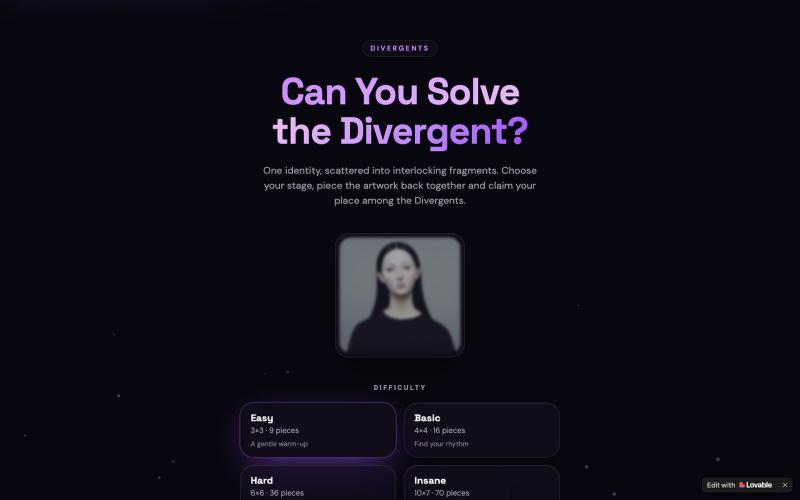
Solve jigsaw puzzles across four difficulty stages from 9 to 70 pieces.

@Zyra__01 · X
First puzzle game First time vibe coding 🥹🌹 Built for @Divergents_eth Huge thanks to @Defihubdao for hosting the class, and @maxxavii for teaching and helping whenever I got stuck😌🫶. Link to the puzzle:
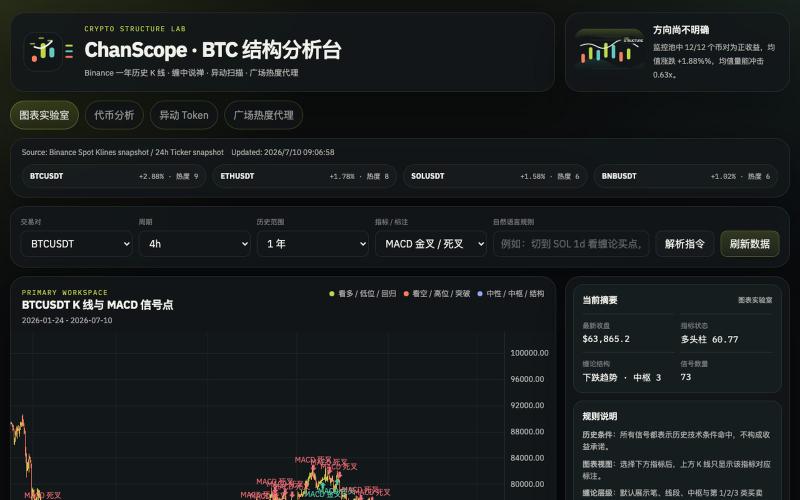
Analyze cryptocurrency markets with Chan Theory patterns, K-line charts, and anomaly detection.

@onehopeA9 · X
用 DAPPOS @dappOS_com 做了一个加密货币缠论分析网站,也是我一直想做没时间做的! 来看看缠论三买的威力: 不是不会写代码。 我自己是程序员,真要硬写当然能写。 但问题是:没时间。🤡 做交易的人都懂,真正消耗人的不是“看一根 K 线”,而是把一堆信息拼起来: K 线结构。 缠论笔、中枢。 一买二买三买。 一卖二卖三卖。 资金费率。 持仓量变化。 成交量异动。 市场舆情。 这些模块涉及太多方面,写得出来,但太费时间。 所以我一直想做一个自己的交易雷达: 接币安历史数据。 用 TradingView 展示 K 线。 自动画缠论结构。 标注买卖点。 再把资金费率、持仓量、成交量和币安广场热度放进去。 想法很清楚。 但一直躺在 TODO 里。 最近用 xbubble 的 Coding 功能试了一下,直接把需求丢进去: “做一个加密货币缠论分析网站,接入币安一年历史数据,用 TradingView 展示 K 线,自动画笔、中枢、一买二买三买、一卖二卖三卖,增加异动分析和币安广场舆情热度。” 它真给我生成了一个能跑的原型。 这次最戳我的不是“AI 会写代码”。 而是 xBubble 把最消耗时间的工程杂活压短了。 以前我自己做: ❌ 搭项目结构 ❌ 爬数据源和图表库 ❌ 写 K 线处理 ❌ 写缠论结构识别 ❌ 做前端交互 ❌ 部署、改样式、修细节 一圈下来,核心想法还没验证,人先累了。 现在变成: ✅ 先描述业务目标 ✅ 让 xBubble 生成可运行原型 ✅ 我再校验规则、调整逻辑、优化体验 ✅ 把时间花在交易理解和产品迭代上 这对程序员其实很有价值。 因为程序员最缺的不是能力,而是时间和注意力。 我这个原型现在大概有几块: 第一,TradingView K 线主图。 用币安数据展示行情,再叠加缠论结构。 第二,笔和中枢。 把原本需要手动盯的结构,先自动画出来。 第三,买卖点雷达。 一买、二买、三买,一卖、二卖、三卖,先帮我筛可能的位置。 第四,异动面板。 资金费率、持仓量、成交量变化,和 K 线结构一起看。 第五,舆情热度。 把币安广场讨论热度也拉进来,看看市场情绪是不是和盘面互相印证。 你可以理解成: 我不是让 AI 替我交易。 我是让 AI 帮我做一个交易前的信息雷达。 我觉得 xBubble 和普通 AI
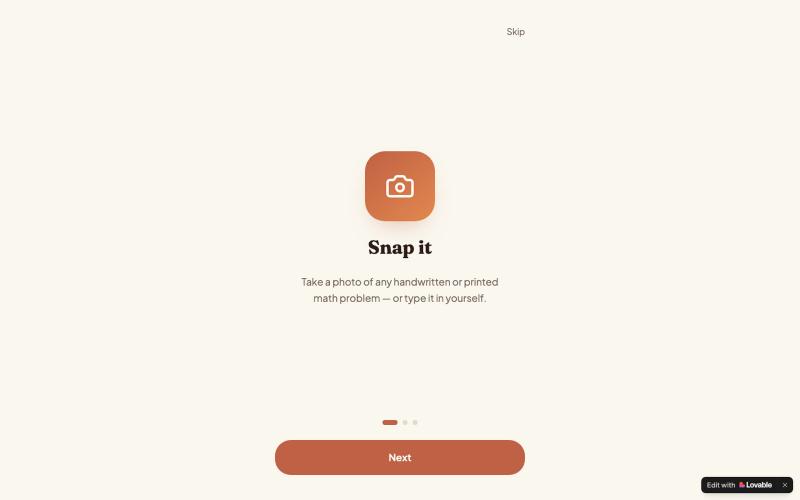
Photograph math equations and word problems to receive instant solutions with step-by-step explanations.

@7spiritz · X
Check out what I just built with Lovable!
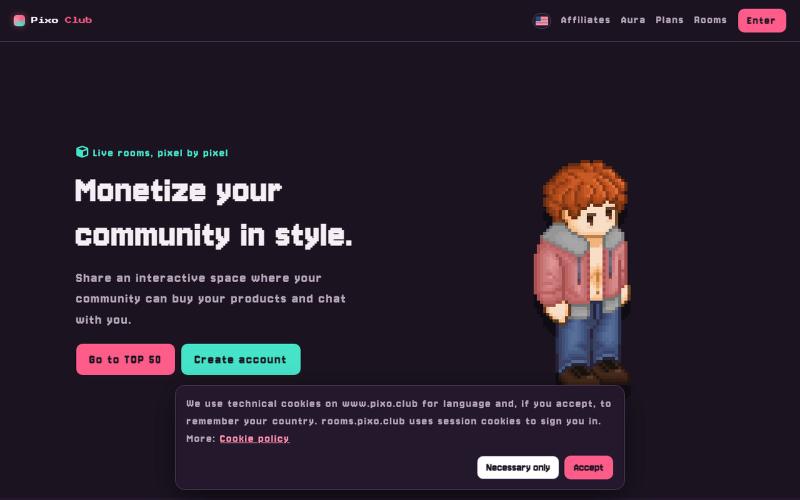
Explore 2D isometric rooms with pixel avatars to connect with a live creator community.

@Josma_Design · X