
Games & Play1 month ago
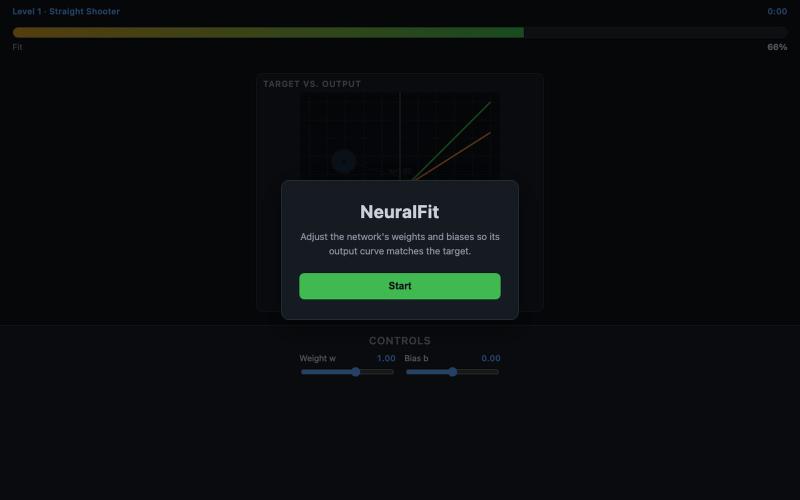
NeuralFit — a curve-fitting game
Adjust neural network weights to fit data curves in this browser-based game.
Gooblebrai
The full gallery
Tech stack
23 projects
Adjust neural network weights to fit data curves in this browser-based game.
Gooblebrai
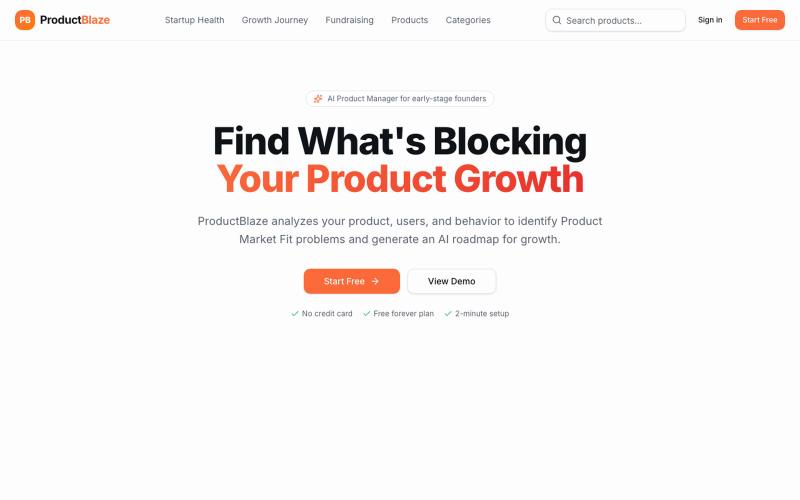
Analyze your product to diagnose market fit and uncover growth bottlenecks.

@teslaptimus · X
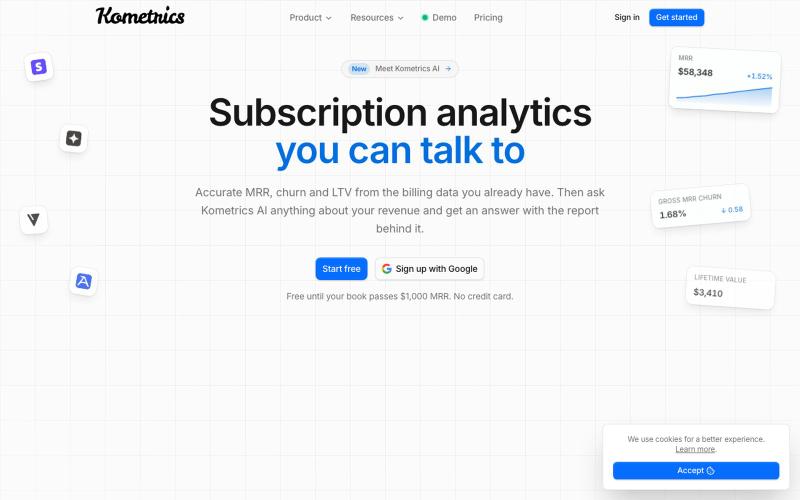
Accurate MRR, churn and LTV for SaaS, built from your Stripe, Paddle, Creem or Asaas billing data. Then ask Kometrics AI anything about your revenue and get an answer with the repo

@camposped · X
Subscription metrics for the AI era:

Explore interactive visualizations of mathematical curves, fractals, symmetry, and topology.

@vkuoo · X
Added more demos showcasing graph-math relationships, built with Codex.
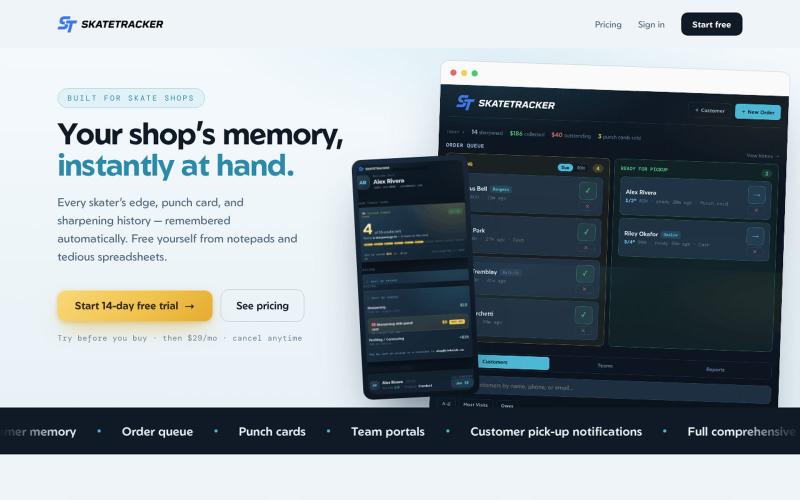
Shop management system for tracking skate sharpening history and customer loyalty cards.

@daveko · X
Built my first app: SkateTracker—a simple way for skate sharpening shops to track customers and sharpening history. Waitlist:
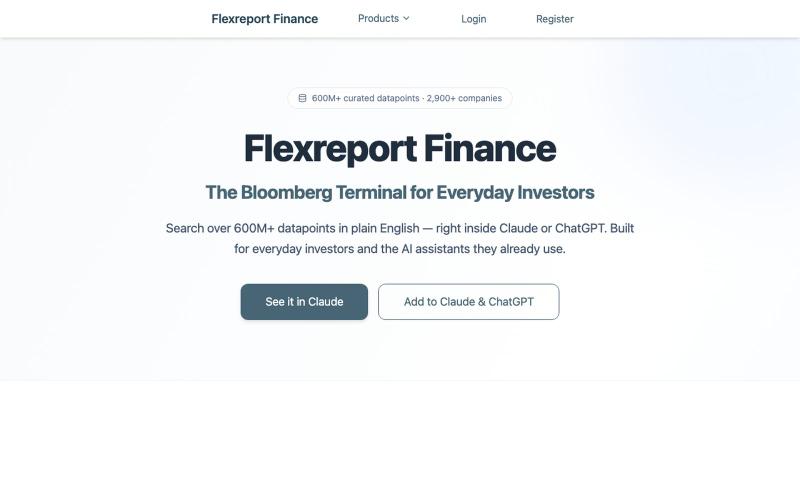
Search 600M+ financial datapoints including fundamentals, filings, and transcripts across 2,900+ companies.
u/SnowSilent7695 · Reddit
Got my first 60 signups through Reddit and want to continue the momentum I've gotten my first 60 signups through Reddit over two months and feel like I have a good thing going. I'm positioning my app as the Bloomberg Terminal for Everyday Investors where you can search over 600M+ financial datapoints in Claude, ChatGPT, or with your own AI Agent at an affordable price. There are other competitors trying to do something similar, but to my knowledge, they seem to be focused on specific us
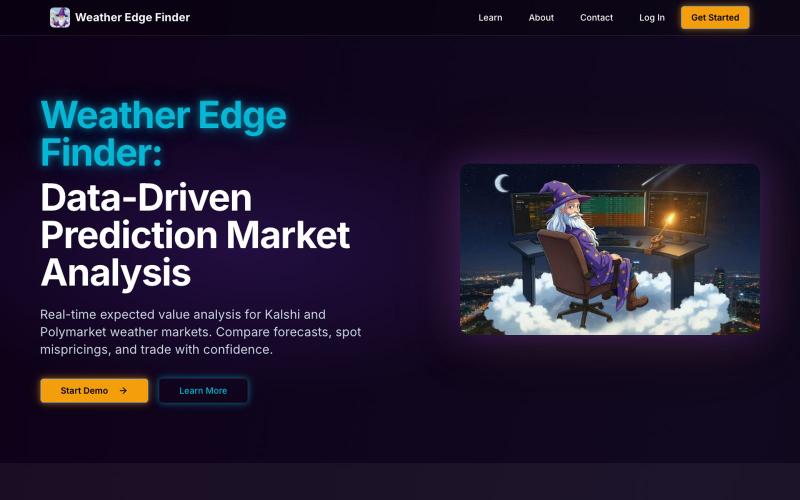
Find statistical edges in Kalshi weather prediction markets with data-backed analysis.

@WingGirlTrader · X
Because the edge is in trading weather markets. And the is a free tool that provides real edge almost daily in temperature bets. And it's FREE
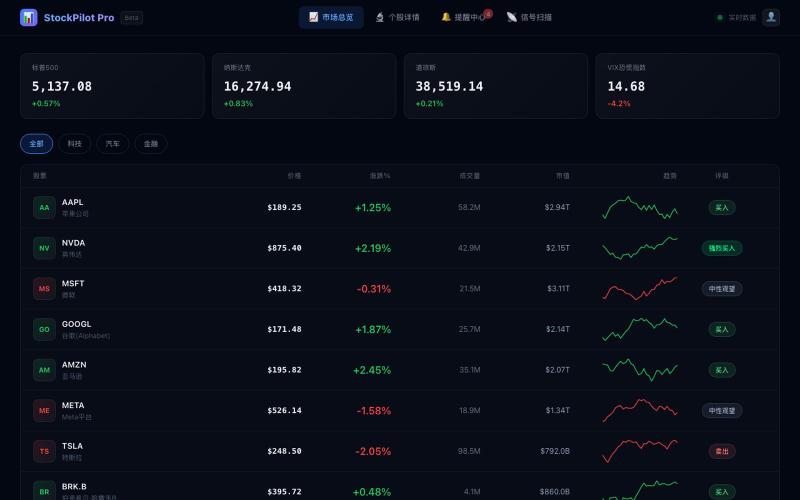
US stock trading signal platform analyzing market data to identify trading opportunities and signals.

@MEJ50749 · X
用 @dappOS_com coding 做了一个美股信号网站: 它和普通美股行情网站最大的区别是:普通网站更多是“给你看行情”,而这个网站更像一个“辅助交易工作台”。 大多数美股网站会把价格、涨跌幅、新闻、财报、K 线分散展示出来,信息很多,但用户还要自己判断: 哪只股票值得看? 现在是什么信号? 这个信号强不强? 有没有触发提醒? 后续要不要复盘? 我这个站的核心思路不是堆信息,而是把交易前的观察流程做成工具: 1. 市场总览不是单纯看涨跌 首页会把美股标的放进观察池里,比如 AAPL、NVDA、MSFT、GOOGL、AMZN、META、TSLA 等,不只是显示价格,还会结合涨跌幅、成交量、市值、PE/PB、行业、52 周区间等信息,让我先快速判断哪些票值得继续看。 2. 最重要的是信号扫描器 这个功能是普通行情站很少直接做成工作流的地方。 网站里有“智能信号扫描器”,可以扫描技术形态,并把信号归类成突破、反转、动量、超卖、超买、金叉、死叉、背离等类型。 比如: NVDA 出现强势突破、量能放大、均线多头排列; AAPL 出现 MACD 金叉、RSI 超卖反弹、布林带下轨支撑; MSFT 出现 MACD 背离,需要注意短期回调; TSLA 出现均线死叉,提示中期下行压力。 这就不是简单告诉我“今天涨了多少”,而是帮我回答一个更交易化的问题: 这只股票现在为什么值得关注,关注点在哪里? 3. 个股详情页更像交易前检查清单 普通网站的个股页往往是行情 + 新闻 + 财务数据。 我这个站的个股详情页更偏“交易前判断”:价格、评级、52 周区间、K 线/成交量、基本面、技术信号、资讯都放在一起。 它的价值是把“发现信号”之后的下一步接住。 扫描器告诉我哪只票有异动,详情页帮我进一步看这个信号有没有质量。 4. 提醒中心是我最喜欢的功能 这个站不是看完就结束,而是有 Alerts Center。 里面可以看到全部提醒、已触发提醒、等待中提醒,还能新建价格/信号提醒。 比如: NVDA 突破 900 美元触发提醒; AAPL 出现 MACD 金叉提醒; TSLA 等待成交量异常触发; META 跌破支撑提醒止损风险; AMZN 突破近期高点提醒动能增强。 这和普通美股网站最大的差异就在这里: 它不只是信息展示,而是把“观察 →
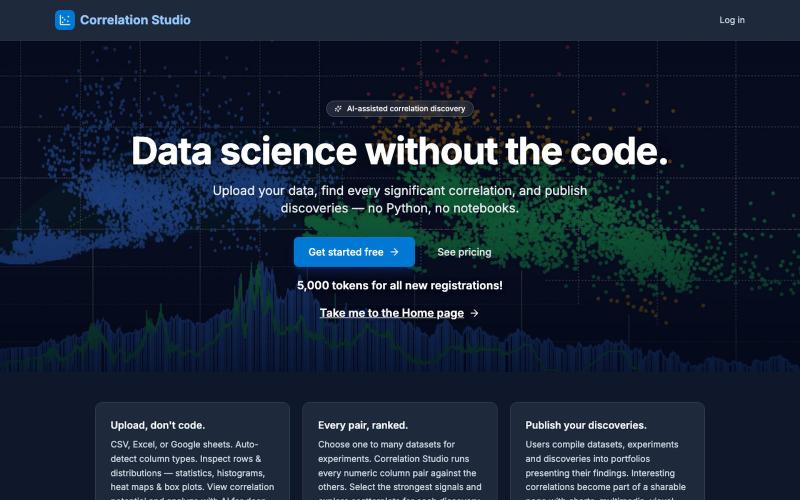
Upload datasets to automatically find statistically significant correlations and causal relationships.

@matthew_meadows · X
Correlation Studio - Discovery Mining • Causation Analysis A powerful new SaaS statistics application that brings the insights of correlation data science to everyone. Data science without the code.
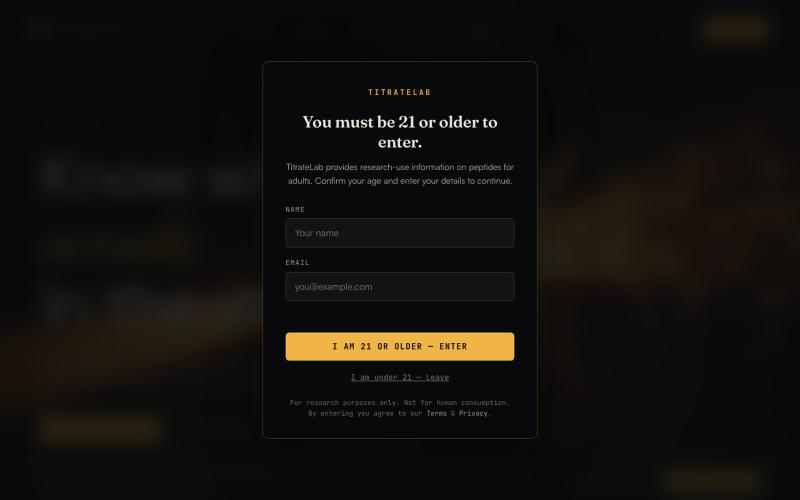
Search lab reports to verify product purity and composition before purchase.

@Titratelab · X
Love the direction. Partner with us at Built by security & software engineers. We scrape Whatsapp, TG, GLP1forums, Meso, Finnrick, Janoshik, Freedom, peptidechat, and even Discord- where we have over 1 billion messaged logged and analyzed. 70,000 COAs stored in our database from thousands of vendors. Sentimental analysis driven trust signals on all communities. This isn't vibe-coded one-shot scraping; we've developed our own inhouse anti-automation bypasses for nearly every major platform.
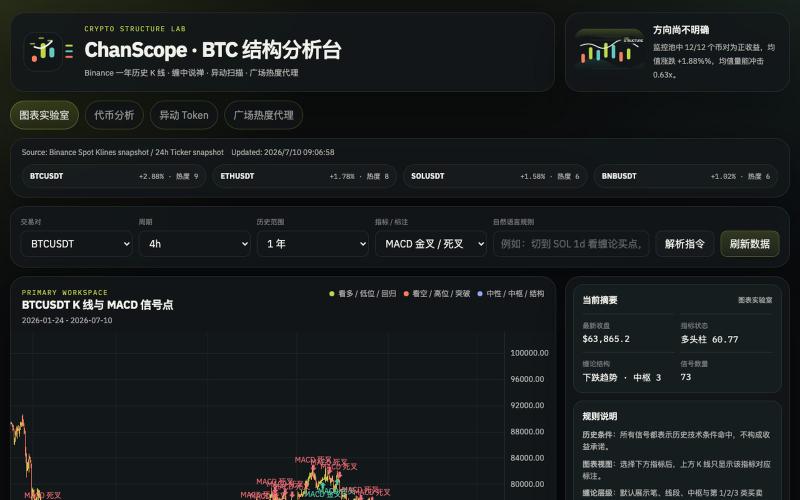
Analyze cryptocurrency markets with Chan Theory patterns, K-line charts, and anomaly detection.

@onehopeA9 · X
用 DAPPOS @dappOS_com 做了一个加密货币缠论分析网站,也是我一直想做没时间做的! 来看看缠论三买的威力: 不是不会写代码。 我自己是程序员,真要硬写当然能写。 但问题是:没时间。🤡 做交易的人都懂,真正消耗人的不是“看一根 K 线”,而是把一堆信息拼起来: K 线结构。 缠论笔、中枢。 一买二买三买。 一卖二卖三卖。 资金费率。 持仓量变化。 成交量异动。 市场舆情。 这些模块涉及太多方面,写得出来,但太费时间。 所以我一直想做一个自己的交易雷达: 接币安历史数据。 用 TradingView 展示 K 线。 自动画缠论结构。 标注买卖点。 再把资金费率、持仓量、成交量和币安广场热度放进去。 想法很清楚。 但一直躺在 TODO 里。 最近用 xbubble 的 Coding 功能试了一下,直接把需求丢进去: “做一个加密货币缠论分析网站,接入币安一年历史数据,用 TradingView 展示 K 线,自动画笔、中枢、一买二买三买、一卖二卖三卖,增加异动分析和币安广场舆情热度。” 它真给我生成了一个能跑的原型。 这次最戳我的不是“AI 会写代码”。 而是 xBubble 把最消耗时间的工程杂活压短了。 以前我自己做: ❌ 搭项目结构 ❌ 爬数据源和图表库 ❌ 写 K 线处理 ❌ 写缠论结构识别 ❌ 做前端交互 ❌ 部署、改样式、修细节 一圈下来,核心想法还没验证,人先累了。 现在变成: ✅ 先描述业务目标 ✅ 让 xBubble 生成可运行原型 ✅ 我再校验规则、调整逻辑、优化体验 ✅ 把时间花在交易理解和产品迭代上 这对程序员其实很有价值。 因为程序员最缺的不是能力,而是时间和注意力。 我这个原型现在大概有几块: 第一,TradingView K 线主图。 用币安数据展示行情,再叠加缠论结构。 第二,笔和中枢。 把原本需要手动盯的结构,先自动画出来。 第三,买卖点雷达。 一买、二买、三买,一卖、二卖、三卖,先帮我筛可能的位置。 第四,异动面板。 资金费率、持仓量、成交量变化,和 K 线结构一起看。 第五,舆情热度。 把币安广场讨论热度也拉进来,看看市场情绪是不是和盘面互相印证。 你可以理解成: 我不是让 AI 替我交易。 我是让 AI 帮我做一个交易前的信息雷达。 我觉得 xBubble 和普通 AI
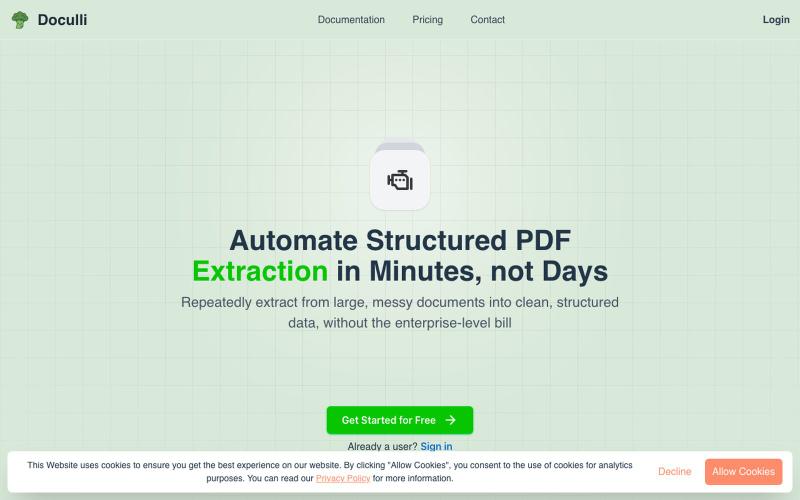
Extract structured data from PDFs automatically using AI for automated workflows.
u/yonnnyy · Reddit
How should I revive my Saas after 300 hours spent developing To provide context, a couple months ago I created a pdf to JSON ai extraction engine. I know... There are hundreds of products like this but for me the value proposition is that other solutions were heavy weight, expensive, non intuitive templates, and was slow. Therefore I created my own and I met my goals. I see genuine value in my product but the lack of users says otherwise. I think my best option is to build on top of this