
Education1 month ago
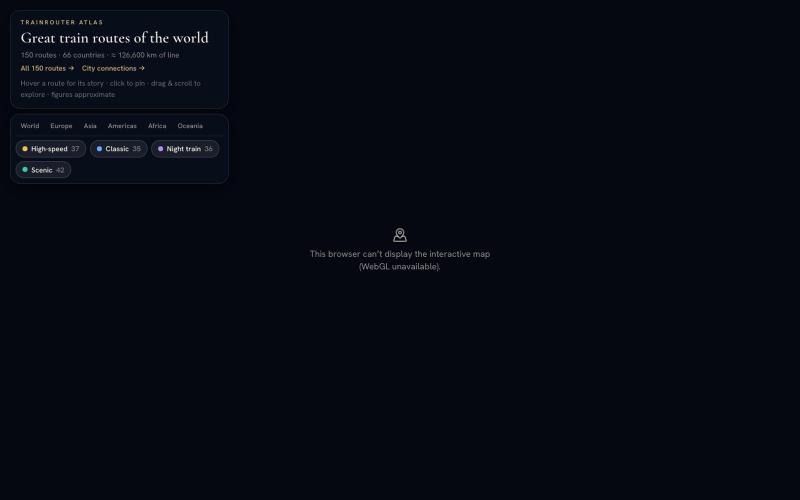
TrainRouter — The world's great train routes on one interactive map
Explore 150 train routes on an interactive world map with facts about each line.

@Flightmussy · X
The full gallery
Tech stack
26 projects
Explore 150 train routes on an interactive world map with facts about each line.
@Flightmussy · X
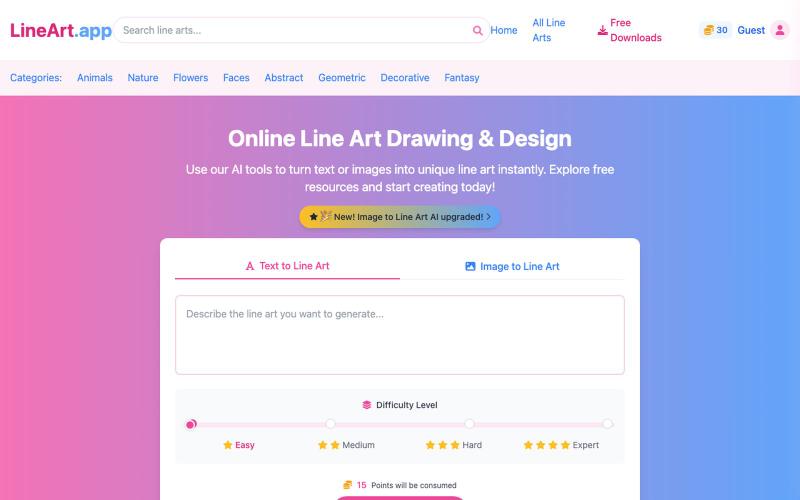
Generate line art drawings and designs online with AI.
AI Line Art Generator — 功能强大的 AI 线稿生成平台,为用户提供多样化的线稿创作与获取服务 - [更多介绍](https://lineart.app/about)
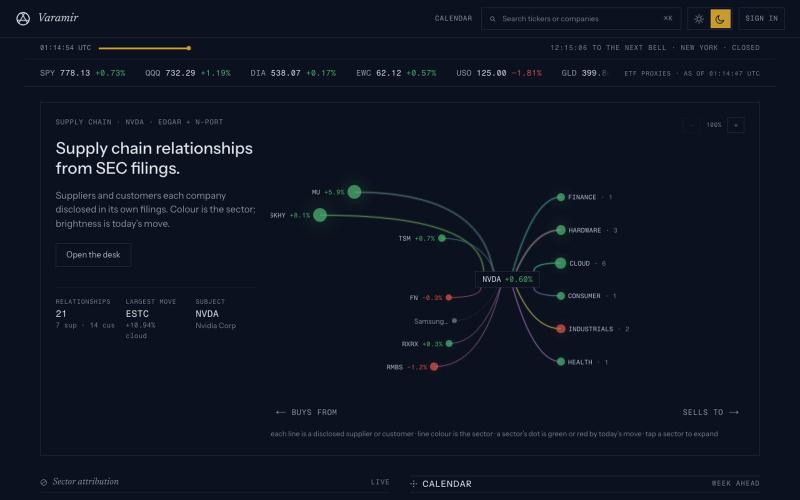
Supplier and customer relationships pulled from SEC filings, with the source sentence behind every tie. Earnings dates, market-implied expected moves, options positioning and ETF e

Varamir
Bloomberg charges hedge funds $25k/year to see who actually supplies who. Varamir does it free. →
Ask anything. Get answers from your chart.

@dadaroo247 · X
Check out what I just built with Lovable!
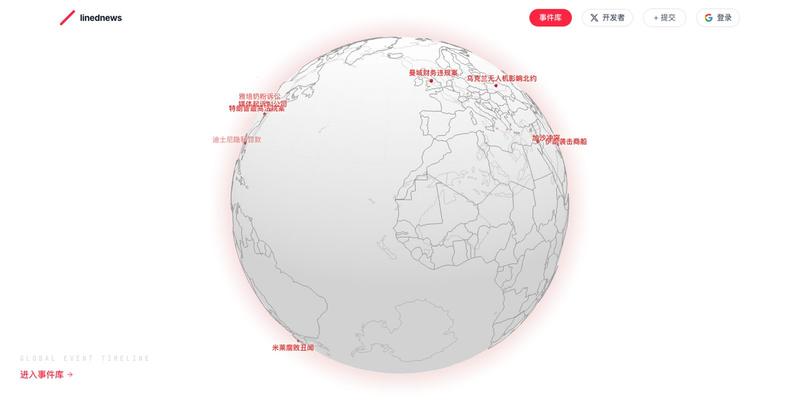
Track global events in crypto, finance, and geopolitics with real-time timelines and alerts.

@garyvgroup · X
怕磕不到孙哥的CP了,我专门做了一个事件追踪网站: 🔔 上线才发现,已经有四五条和他有关的事件正在被追踪。 @sunyuchentron 孙哥活真多呀。 网站还在追踪 Gate 被盗,BitMart等事件,每个瓜尽量保留来源,支持Tg提醒,怕忘事的可以用起。#tron
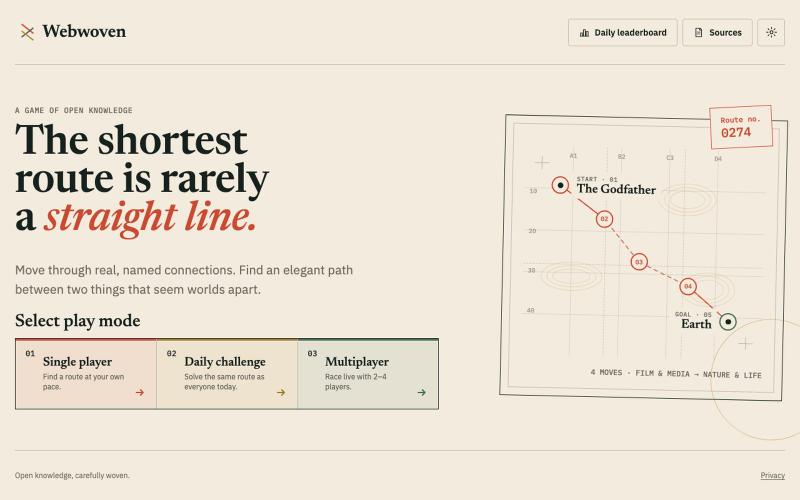
Connect any two topics by finding paths through real Wikidata relationships.
u/hyperschlauer · Reddit
I built a free knowledge-graph game where every move follows a real Wikidata relationship I’m building Webwoven for OpenAI Build Week, and the beta is now live: https://www.webwoven.org It’s inspired by Wikipedia hopping: you start with one topic and try to reach a target in as few moves as possible. Every move follows a real relationship from a reviewed Wikidata graph. The game therefore shows why two topics are connected instead of treating ordinary page links as paths. Webwoven curr
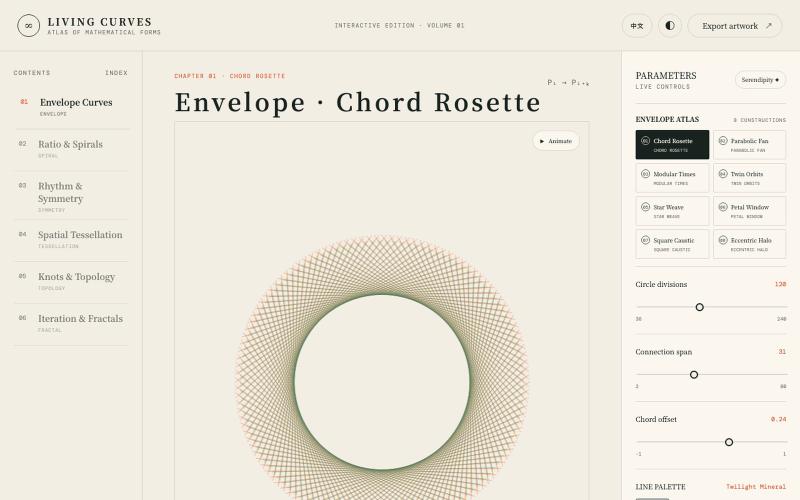
Explore interactive visualizations of mathematical curves, fractals, symmetry, and topology.

@vkuoo · X
Added more demos showcasing graph-math relationships, built with Codex.
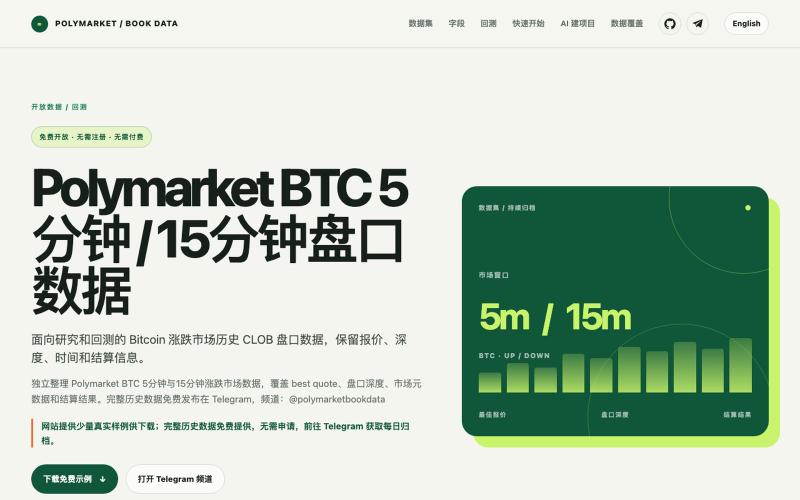
免费提供 Polymarket BTC 5分钟与15分钟涨跌市场历史盘口数据,包含 best quote、盘口深度、市场元数据和结算结果,适用于研究和回测。

@puniamark · X
最近自己做了一个 Polymarket BTC 历史盘口数据采集器。 因为自己有策略在跑,需要经常复盘回测,但网上能找到的公开数据基本都不完整,质量也不太稳定,所以干脆自己写了一个。 反正自己用也是用,就分享出来给有需要的人。 网站: 进网站点右上角TG就可以下载历史数据了

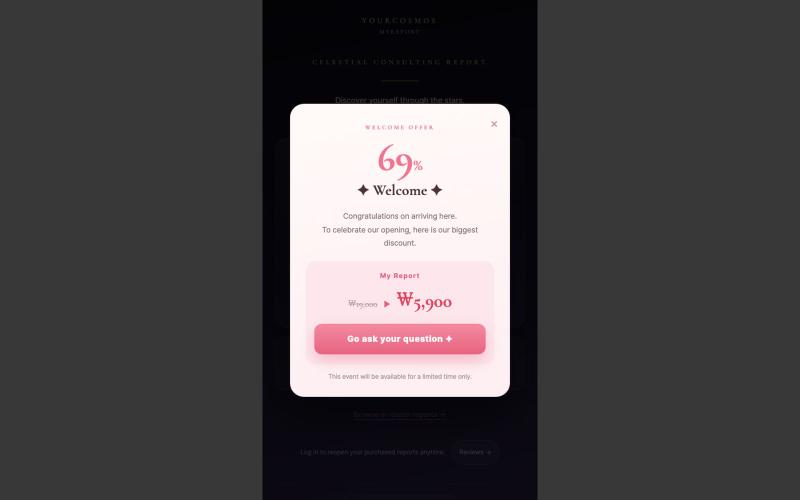
Clarity v2.0, Personalized natal chart readings and astrological forecasts. Know your patterns and break the loop.

@byquantanum · X

Map founder DNA across behavioral dimensions to find compatible investors.

@enoch_fyw · X
MBTI for founders, connect with Investors the fun way!
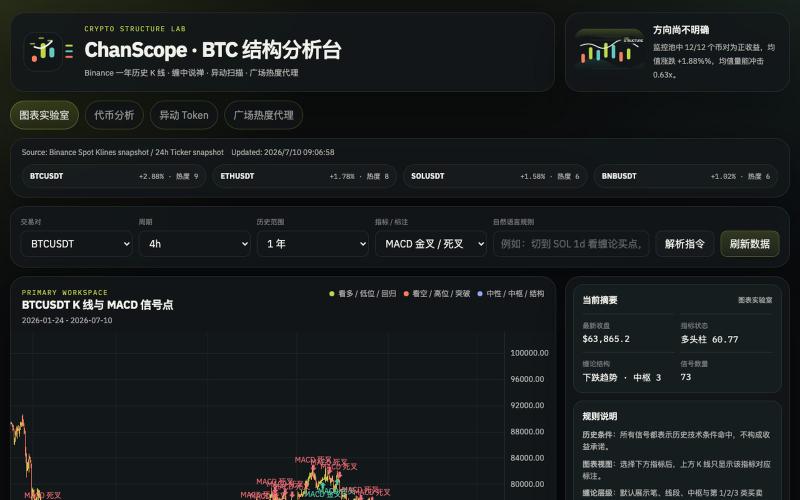
Analyze cryptocurrency markets with Chan Theory patterns, K-line charts, and anomaly detection.

@onehopeA9 · X
用 DAPPOS @dappOS_com 做了一个加密货币缠论分析网站,也是我一直想做没时间做的! 来看看缠论三买的威力: 不是不会写代码。 我自己是程序员,真要硬写当然能写。 但问题是:没时间。🤡 做交易的人都懂,真正消耗人的不是“看一根 K 线”,而是把一堆信息拼起来: K 线结构。 缠论笔、中枢。 一买二买三买。 一卖二卖三卖。 资金费率。 持仓量变化。 成交量异动。 市场舆情。 这些模块涉及太多方面,写得出来,但太费时间。 所以我一直想做一个自己的交易雷达: 接币安历史数据。 用 TradingView 展示 K 线。 自动画缠论结构。 标注买卖点。 再把资金费率、持仓量、成交量和币安广场热度放进去。 想法很清楚。 但一直躺在 TODO 里。 最近用 xbubble 的 Coding 功能试了一下,直接把需求丢进去: “做一个加密货币缠论分析网站,接入币安一年历史数据,用 TradingView 展示 K 线,自动画笔、中枢、一买二买三买、一卖二卖三卖,增加异动分析和币安广场舆情热度。” 它真给我生成了一个能跑的原型。 这次最戳我的不是“AI 会写代码”。 而是 xBubble 把最消耗时间的工程杂活压短了。 以前我自己做: ❌ 搭项目结构 ❌ 爬数据源和图表库 ❌ 写 K 线处理 ❌ 写缠论结构识别 ❌ 做前端交互 ❌ 部署、改样式、修细节 一圈下来,核心想法还没验证,人先累了。 现在变成: ✅ 先描述业务目标 ✅ 让 xBubble 生成可运行原型 ✅ 我再校验规则、调整逻辑、优化体验 ✅ 把时间花在交易理解和产品迭代上 这对程序员其实很有价值。 因为程序员最缺的不是能力,而是时间和注意力。 我这个原型现在大概有几块: 第一,TradingView K 线主图。 用币安数据展示行情,再叠加缠论结构。 第二,笔和中枢。 把原本需要手动盯的结构,先自动画出来。 第三,买卖点雷达。 一买、二买、三买,一卖、二卖、三卖,先帮我筛可能的位置。 第四,异动面板。 资金费率、持仓量、成交量变化,和 K 线结构一起看。 第五,舆情热度。 把币安广场讨论热度也拉进来,看看市场情绪是不是和盘面互相印证。 你可以理解成: 我不是让 AI 替我交易。 我是让 AI 帮我做一个交易前的信息雷达。 我觉得 xBubble 和普通 AI
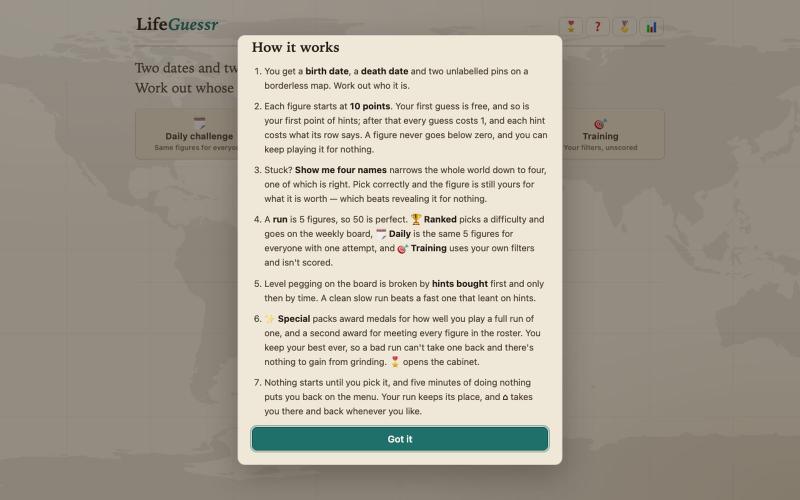
Guess historical figures from their birth/death dates and map locations in a daily game.
u/data_guy_123_123 · Reddit
Geography/History game: LifeGuessr! Hi all! I worked over the last 3 months on this game: lifeguessr.com The concept is very simple: you get a birthdate, a deathdate (if relevant), and a map, and your goal is to identify the historical figure these details pertain to. Multiple hints are available to make it a bit more fun I have expended it to a wide collection of figures, including contemporary ones. I also had a bit of fun with some custom themes, rewards, etc. This game is comple