
Social & Community1 month ago
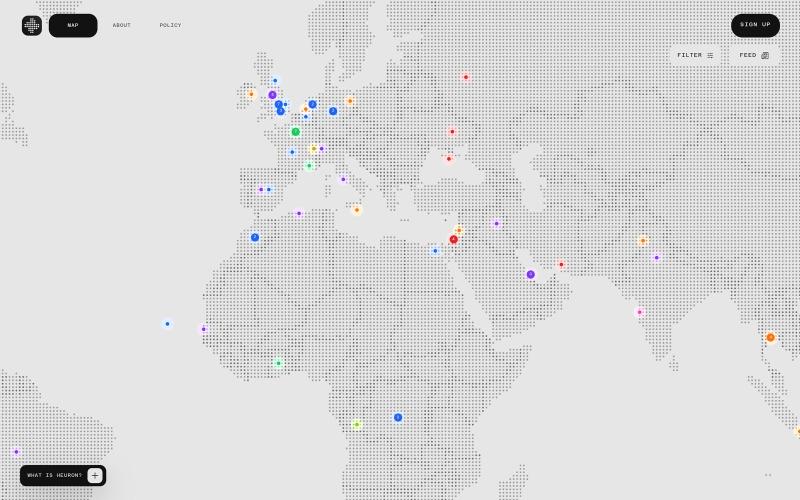
Heuron — Visual News Engine
Explore world events through a visual, source-aware news map.

@brryg_ · X
sure man, working on a social and visual news hub called heuron - lmk what you think!
The full gallery
Tech stack
60 projects
Explore world events through a visual, source-aware news map.
@brryg_ · X
sure man, working on a social and visual news hub called heuron - lmk what you think!
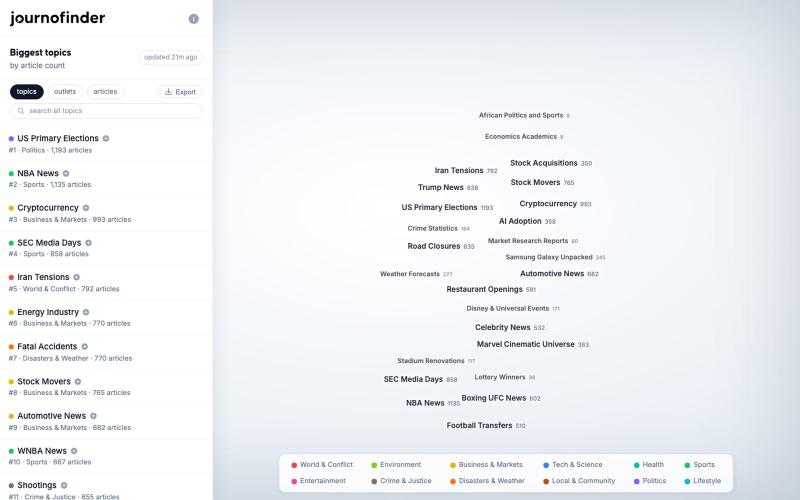
Explore an hourly-updated map of the news cycle with 150,000+ stories clustered by topic.
sach90 · HN
A live map of the news cycle, rebuilt hourly from embedded headlines
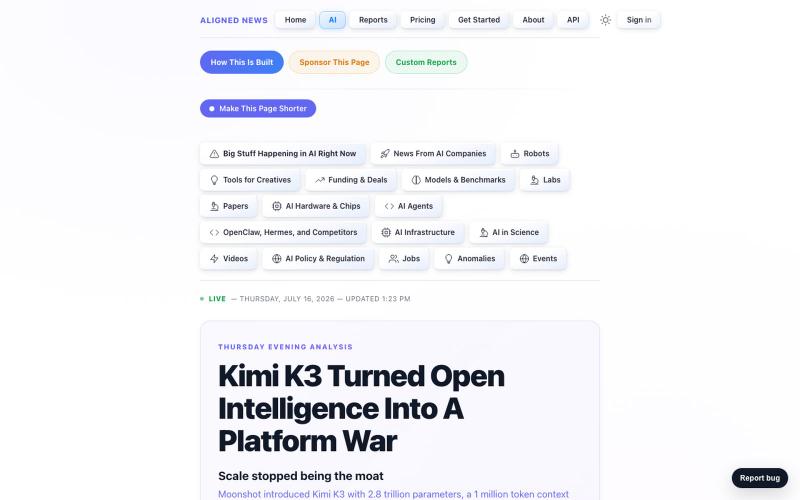
Track real-time AI news and signal detection across robotics, models, products, and business.

@Scobleizer · X
I vibe coded: :-)
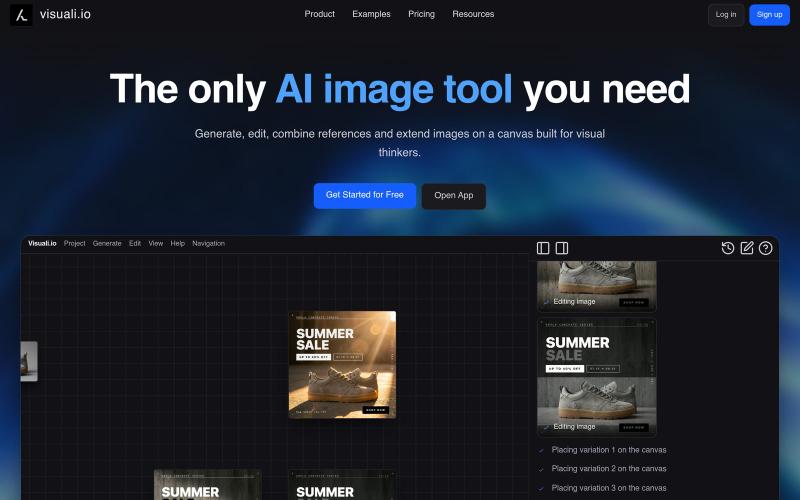
Browser-based AI image editor and generator with infinite canvas, available as desktop and mobile apps.
visuali · HN
Like Claude Code for Images
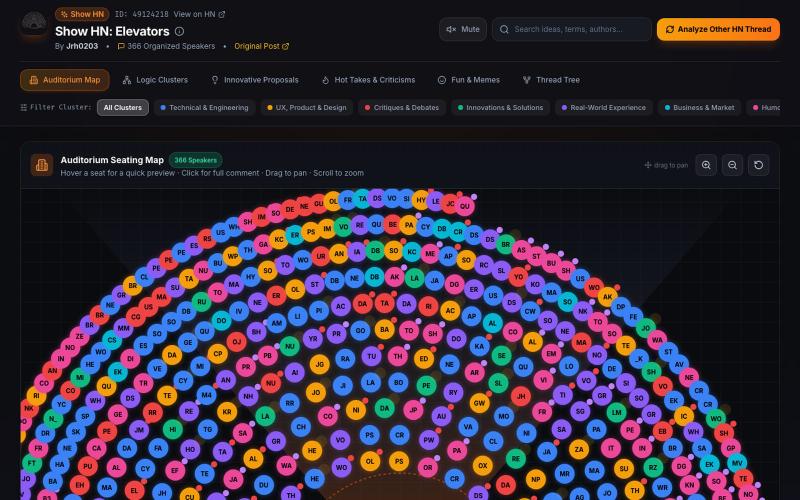
Explore Hacker News discussions via interactive spatial visualization and AI-powered summaries.
ahmedxuhri · HN
Postroom – HN thread 2D Visualizer as auditorium AI-powered summaries

Real-time LLM-powered news aggregator surfacing trending stories with live updates.
tdubey · HN
DWS A LLM Generated, "Drudge Report" style news site
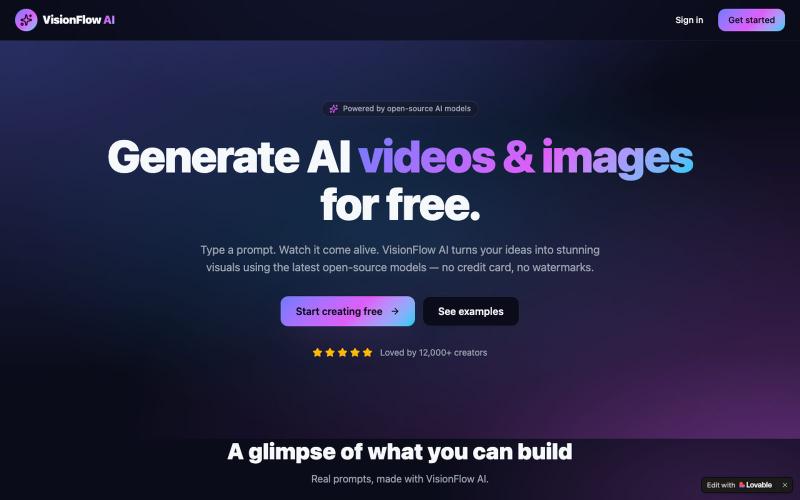
Generate AI images and videos from text or photos free daily using open-source models.

@GayatriYaligar · X
Check out what I just built with Lovable!
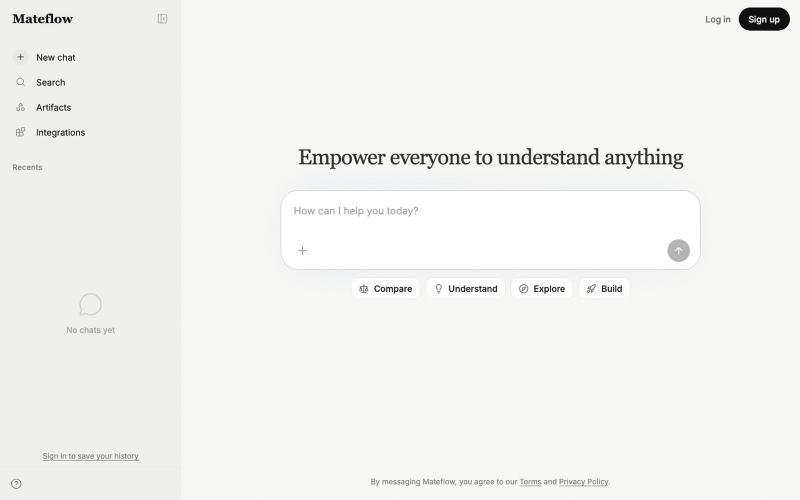
Ask questions to get visual answers as tables, charts, and flows instead of text.

@butmatthew17 · X
just check it out completely for free
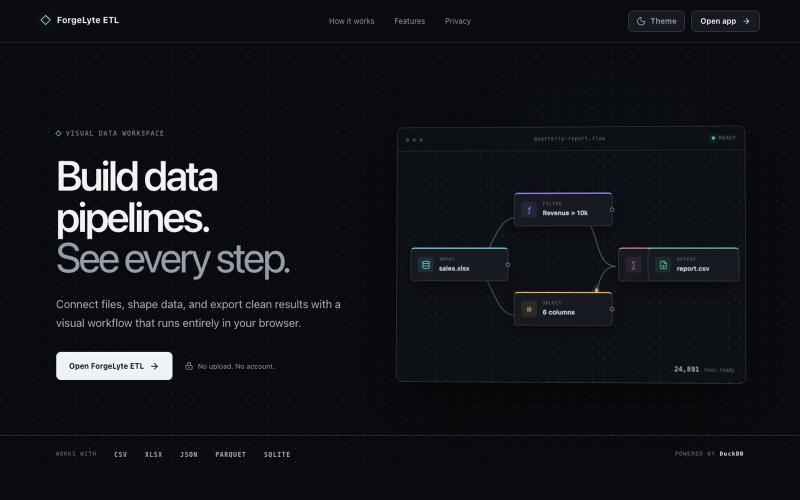
Build visual data ETL pipelines for CSV, Excel, JSON, and Parquet files in your browser.

@ashkans_dev · X
An ETL tool:
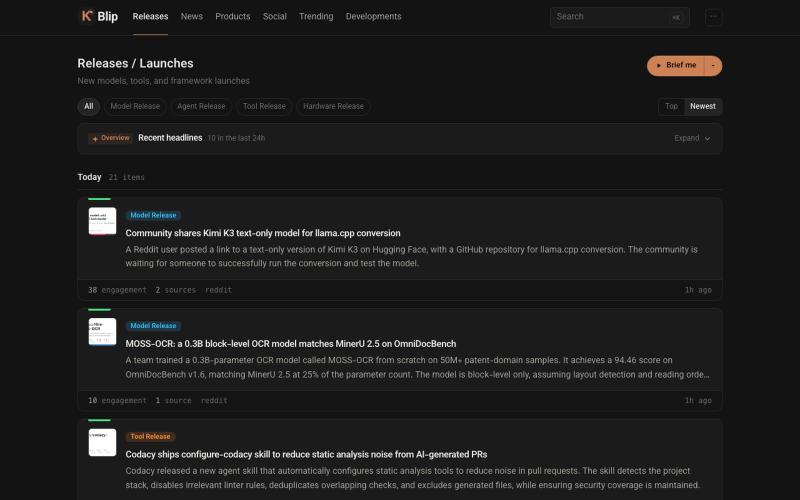
Track AI and LLM news and model launches from 100+ sources.
jonam21 · HN
KBlip – turns AI/LLM news across 100 sources into daily digest threads
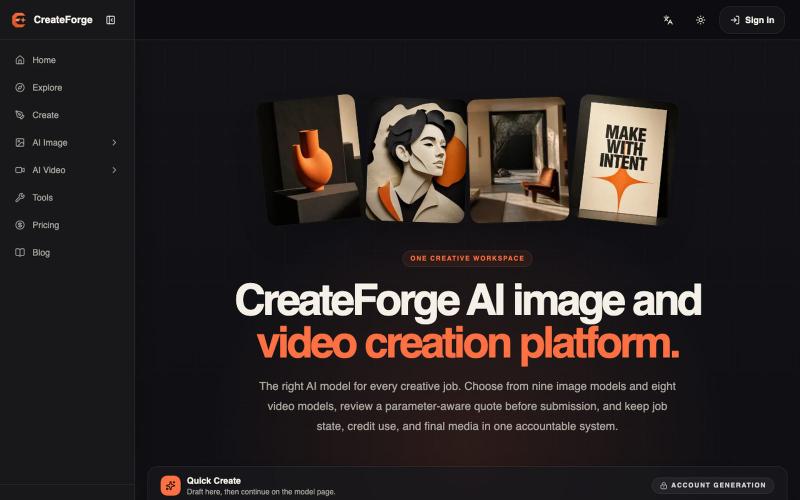
AI workbench for generating and managing images and videos with 17 models and private media library.
CreateForge AI — AI 图像与视频生成工作台,接入 17 个模型,支持 Seedance 2.5、Veo 3.1 等模型的文生图、图生图、文生视频和图生视频,提供积分报价、任务中心与私有媒体库

A visualization language designed for AI agents to create and interact with charts.
chenglong-hn · HN
Data visualizations are the bridge between user and data. But building AI agents that can generate visualizations reliably can be very tricky: - simple chart specs can be reliable, but generated charts are often of low quality due to reliance on system defaults; - complex chart specs with explicit details can produce good-looking charts, but they are verbose and agents can struggle with reliability We figured out it is a limitation on the language issue (not just AI capability thing) -- current visualization languages are a bit too low-level for AI agents, requiring them to explicitly make visual decisions that are supposed to be handled by a good compiler. Flint is a visualization intermediate language to address this issue, allow AI agents to solve this last-mile human-agent interaction problem. It provides a simple semantic-type based specification, and contains a layout optimization engine that can produce good-looking charts (filled with derived low-level details) from simple