
Developer Tools7 hours ago
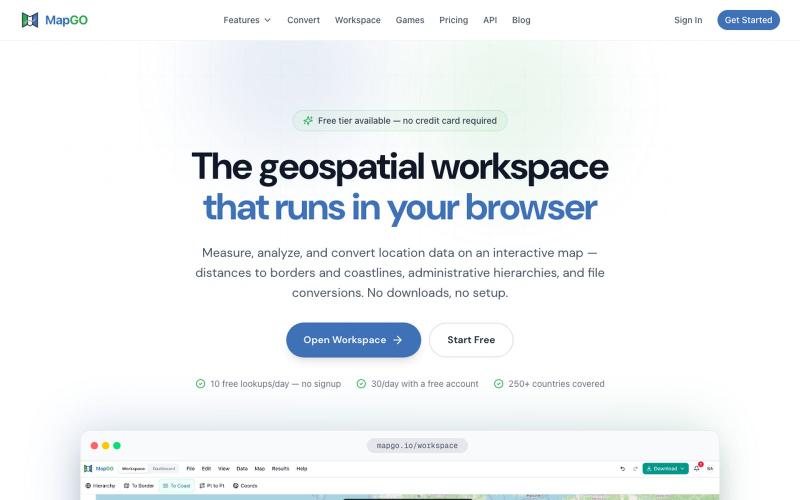
MapGO - Online Mapping Services | GIS Data Software & Geospatial Mapping Platfor
Analyze geospatial data, calculate distances, and process bulk CSV files with GIS mapping tools.

@JanasSebastian · X
The full gallery
Tech stack
60 projects
Analyze geospatial data, calculate distances, and process bulk CSV files with GIS mapping tools.
@JanasSebastian · X
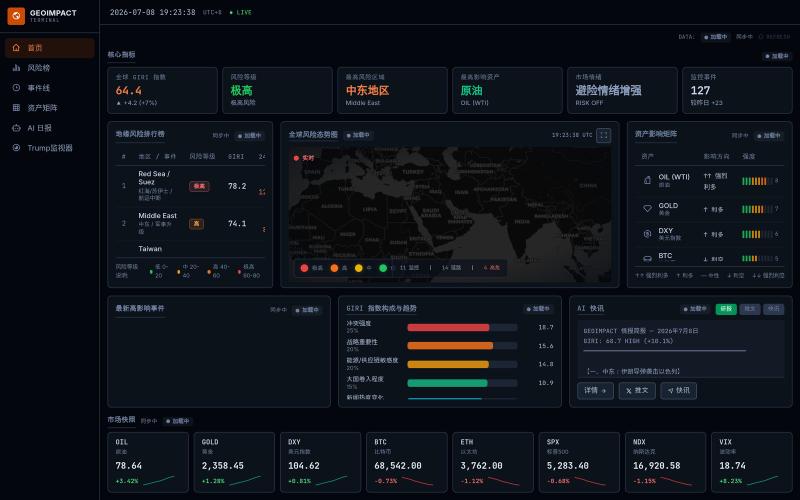
Observe geopolitical and geographical information on interactive maps

@oyoovi · X
做了一个地缘信息观察的网站,供大家免费使用: 首页基本要素综合
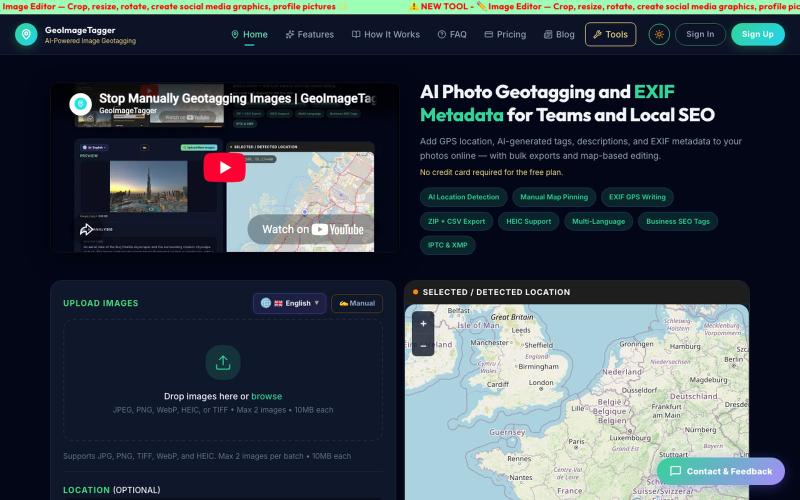
Geotag photos and edit metadata with AI-generated tags.
tosief · HN
GeoImageTagger – AI image geotagging and metadata editor
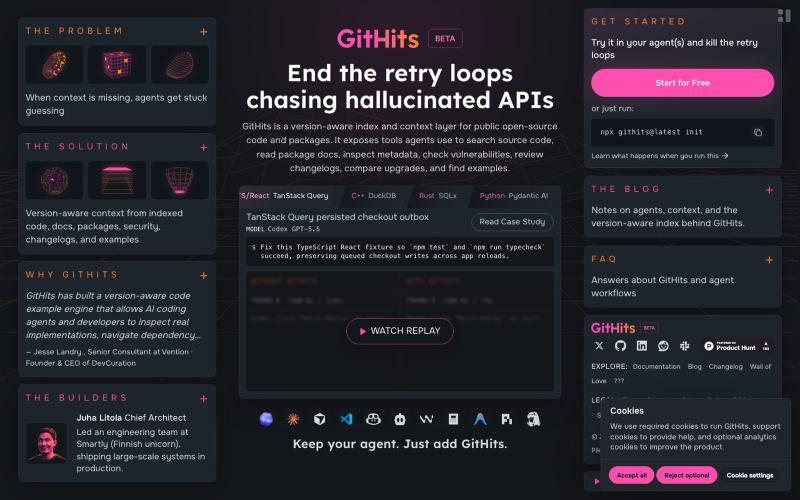
Search indexed open-source code and packages with version history, metadata, and dependency information.

@Jack_Timonen · X
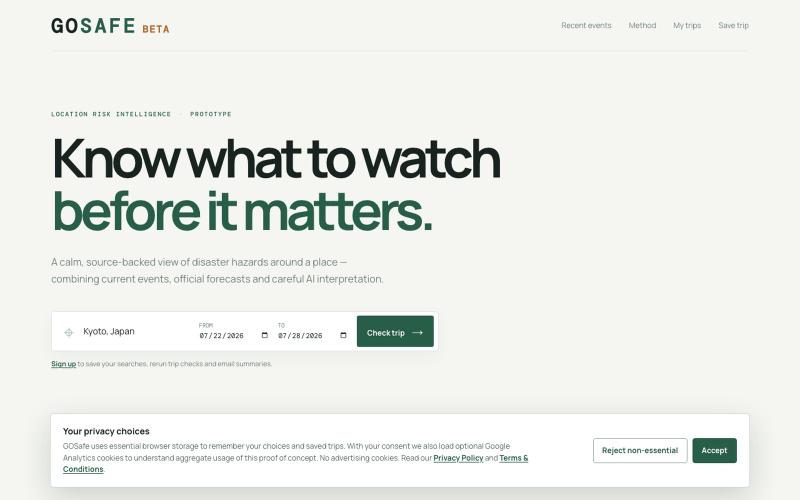
View disaster hazards and location risks for travel destinations.

@HappyMonkeyAI · X
GOSafe was another #AI powered #app concept from last week too that aims to help to #travellers stay informed about destinations they are thinking of visiting
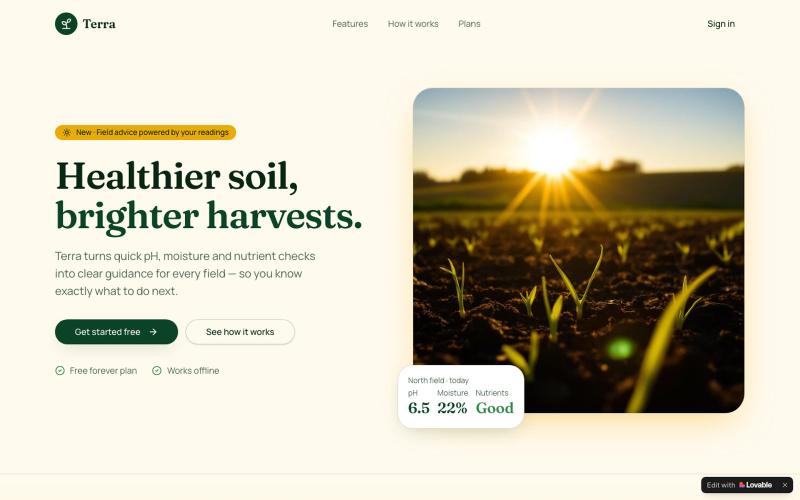
Log soil metrics to track field health and receive AI-powered agronomic guidance.

@batmanyussif · X
Check out what I just built with Lovable!
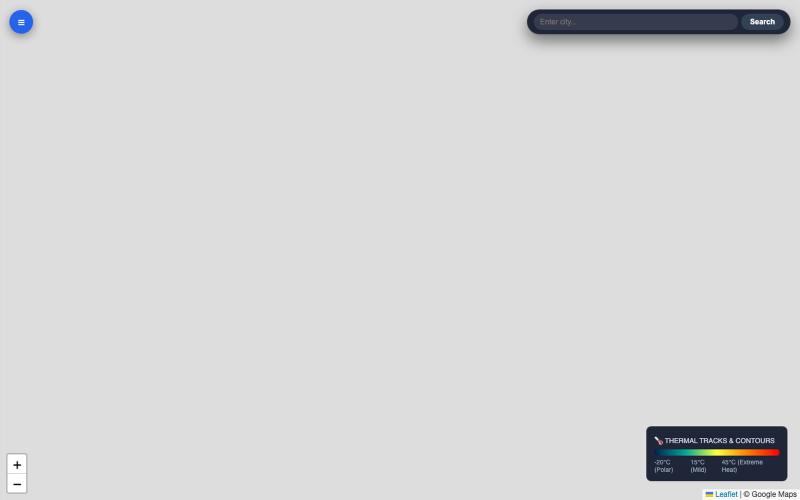
View real-time weather radar with atmospheric layers, satellite imagery, and storm tracking.

@ebrahim_dev3 · X
An interactive, high-contrast weather radar application. The system provides real-time atmospheric visual layers over high-resolution satellite imagery with distinct airflow, thermal contours, and storm tracks.

A visualization language designed for AI agents to create and interact with charts.
chenglong-hn · HN
Data visualizations are the bridge between user and data. But building AI agents that can generate visualizations reliably can be very tricky: - simple chart specs can be reliable, but generated charts are often of low quality due to reliance on system defaults; - complex chart specs with explicit details can produce good-looking charts, but they are verbose and agents can struggle with reliability We figured out it is a limitation on the language issue (not just AI capability thing) -- current visualization languages are a bit too low-level for AI agents, requiring them to explicitly make visual decisions that are supposed to be handled by a good compiler. Flint is a visualization intermediate language to address this issue, allow AI agents to solve this last-mile human-agent interaction problem. It provides a simple semantic-type based specification, and contains a layout optimization engine that can produce good-looking charts (filled with derived low-level details) from simple
@joovier_ https://t.co/keG2Rl4hD4 data analysis app. Check out

@MourynCher16712 · X
data analysis app. Check out
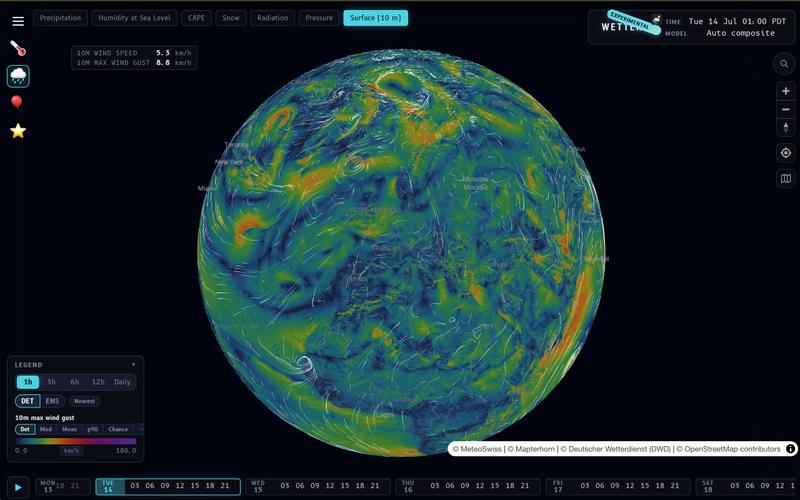
Visualize and predict weather with on-device calculations and custom aggregation modes.
__mp · HN
I built my own weather prediction / visualization app: https://wx.rsp.li (on-device temperature lapsing, on device interpolation modes, user-selectable aggregations, etc…). One of these days I should do a writeup. I also asked Claude to build a photo gallery for me https://places.pascalspoerri.ch (HDR, map support, similar images)
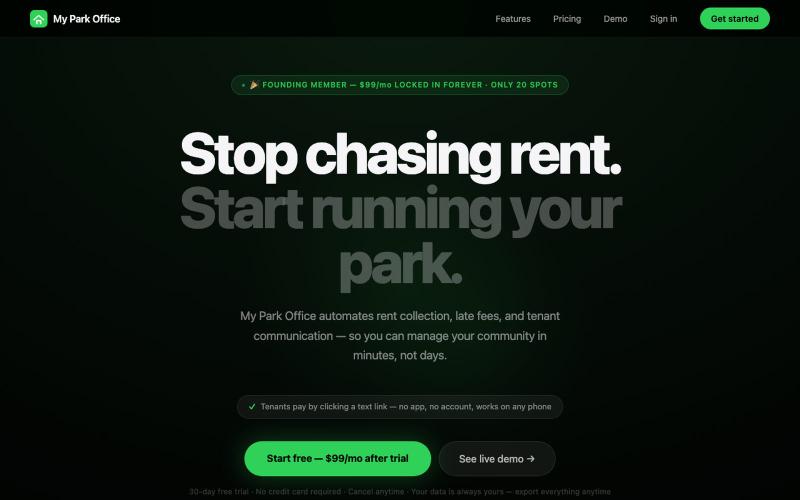
Manage mobile home parks with SMS rent collection, digital leases, and maintenance tracking.
u/TheeCloutGenie · Reddit
RV Park SAAS So that I’ve used wispr flow to help write this so it’s a disclaimer. I recently built myparkoffice.com , and to be honest, it started as total "AI slop." I asked AI to identify a "pen and paper" industry that was ripe for AI disruption. When it suggested RV parks, I thought I’d struck gold. A low-tech niche with clear inefficiencies? Sounds like the perfect solo-founder dream, right? I leaned heavily into AI to build the entire thing, treating it more like a fun experiment th
Free online tool for creating flowcharts, process diagrams, org charts, and UML diagrams.

@N0V4Dev · X
I found a tool called Next AI that links AI capabilities directly with diagrams. It lets you build and edit diagrams using natural language prompts instead of clicking around the canvas manually. It's a handy way to sketch out architecture when you don't want to drag every box yourself. The project is built on TypeScript with React 19 and Next.js. It supports multiple AI providers and even includes an MCP Server. This means you can use it with the Claude Code CLI to generate diagrams from your terminal. Deployment options are flexible too. You can run the tool locally with Docker or push it to Vercel and Cloudflare Workers. It supports multi provider setups so you can pick the backend that fits your workflow. #Nextjs #AI #Diagrams #TypeScript