
Productivity1 week ago
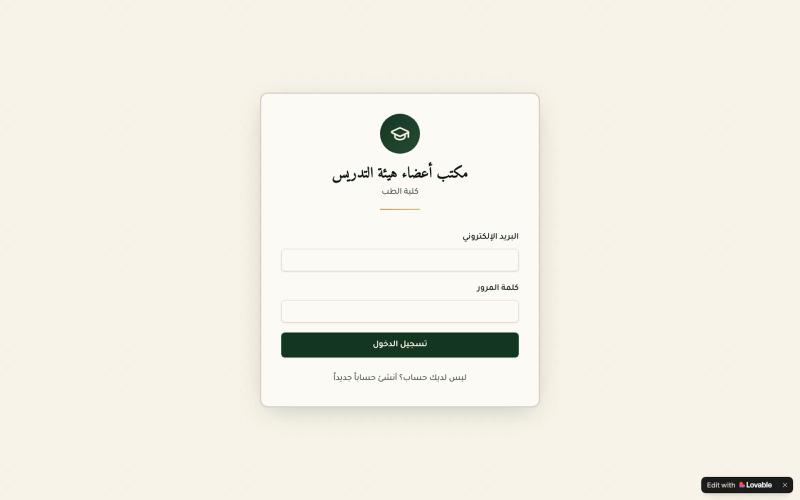
لوحة المعلومات — مكتب أعضاء هيئة التدريس
Manage faculty members' data, ranks, promotions, and teaching loads in academic institutions.

@FalhdirA · X
Check out what I just built with Lovable!
The full gallery
Tech stack
60 projects
Manage faculty members' data, ranks, promotions, and teaching loads in academic institutions.
@FalhdirA · X
Check out what I just built with Lovable!
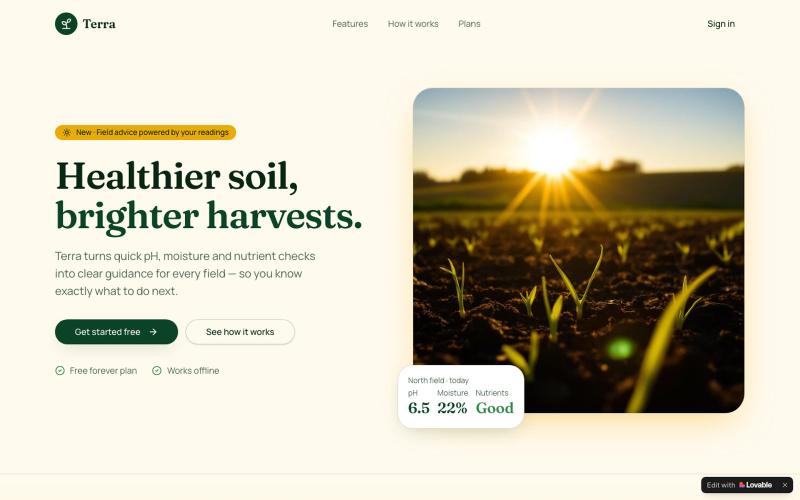
Log soil metrics to track field health and receive AI-powered agronomic guidance.

@batmanyussif · X
Check out what I just built with Lovable!
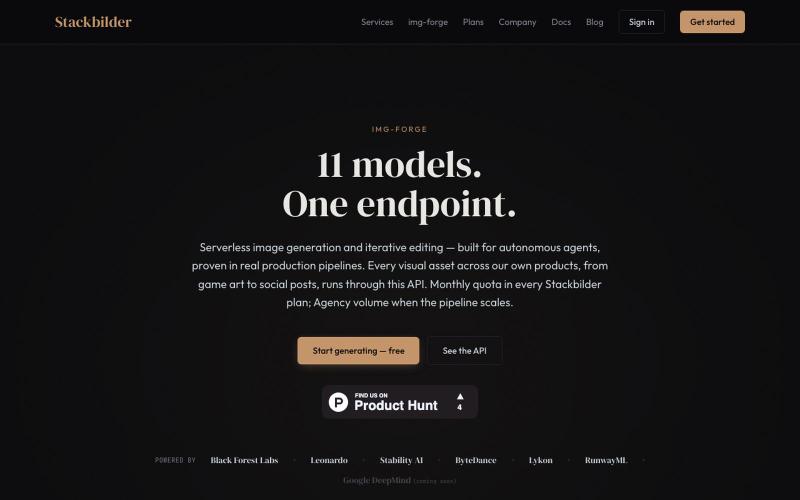
API for text-to-image generation and editing with 11 AI models.
u/texo_optimo · Reddit
I got tired of leaving claude code for image assets so I made Img-Forge - a remote txt2img MCP, API SoloDev here (doing this outside of my 9-5); I've decided to start shipping instead of remaining in a state of perpetual build. I'm shipping the tool I use most in my own work: Img-forge. Link is here but I have a Product Hunt listing for it here. There is a small free tier to check it out. Stackbilder.com is the platform UI; but Easiest way to get your agent working with it is via mcp
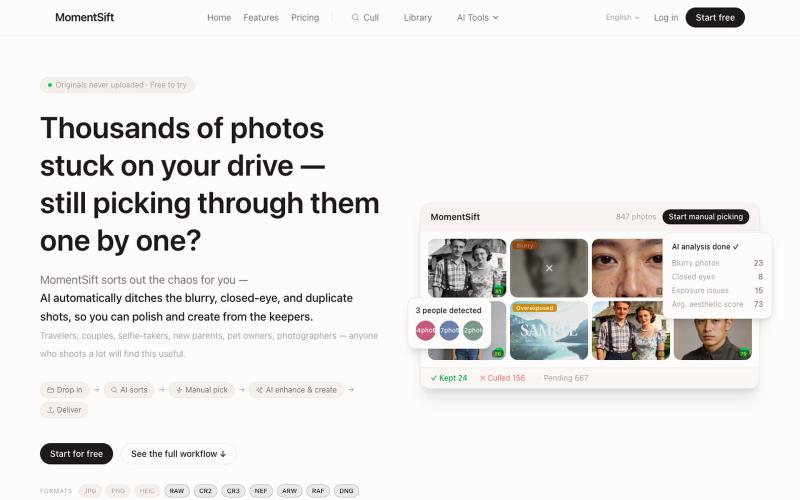
Cull, enhance, and generate photos with AI in your browser.
ansheng_hu · Product Hunt
MomentSift Cull, enhance, and create better photos with AI
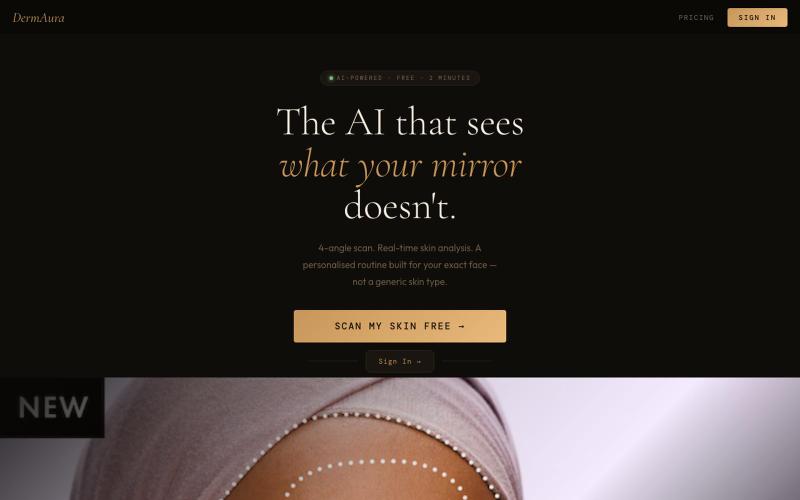
AI analyzes your skin and stress levels from photos.

@anujbhargava50 · X
AI that knows your skin better than you do. 🙌🏻Give it a try
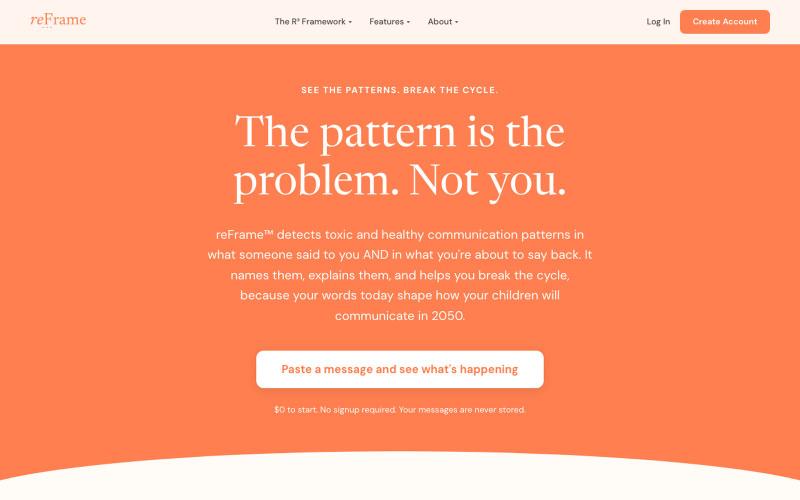
Analyze texts to identify 10 toxic and 7 healthy communication patterns.

@WEreFrame · X
Underrated...well I wouldn't say that because I'm just starting, but overlooked maybe. The impact on humanity will be noticed across the globe. Stop reacting. Start reFraming.
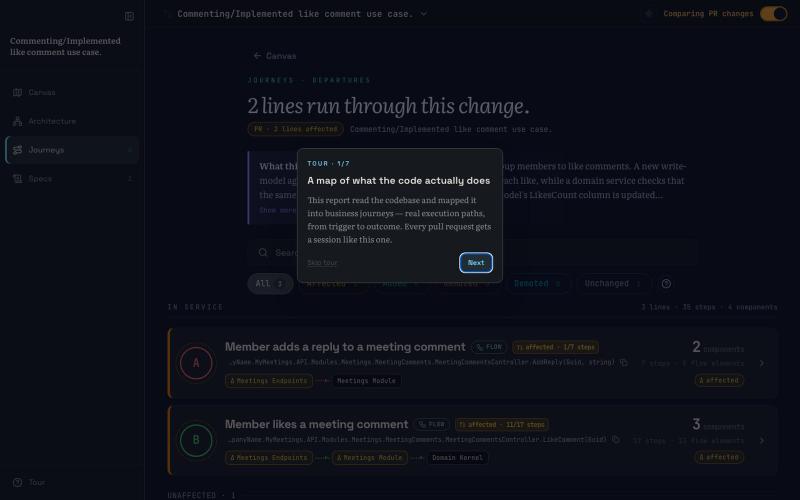
Analyze pull requests to understand changes, distinguish important modifications from trivial ones, and identify potential regressions.
logphase · HN
I've always struggled to hold a large PR in my head. AI-assisted coding has made it worse. Especially when dozens of files are modified, it became harder to understand what changed: distinguishing important changes from trivial ones and identifying if regressions were introduced. I was also tired of switching between file and method to build the whole picture in my head — I wanted all the context at the point of the function I was reviewing. I guess I'm just more of a visual person. I realized t
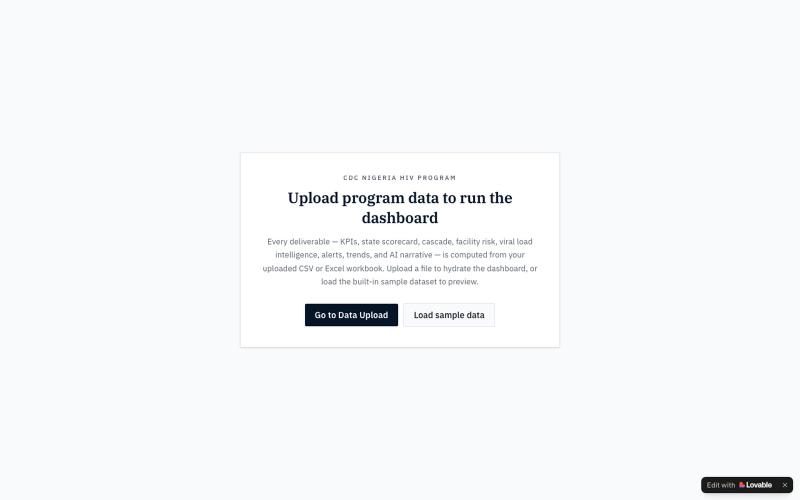
Executive overview dashboard for CDC Nigeria's HIV program showing KPIs, treatment cascade, and performance metrics.

@Spernixx · X
Check out what I just built with Lovable!
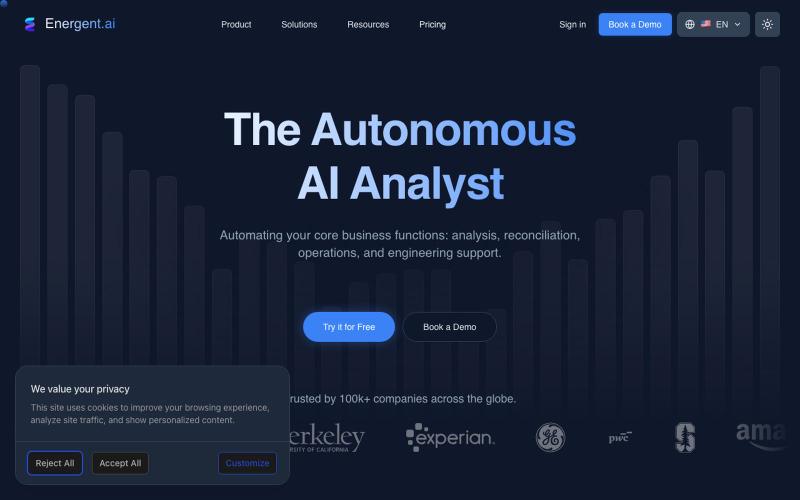
No-code platform for data analysis and document extraction.

@0xLingjieKong · X
Hey @Sarakhan49309, I'm currently building an agent specialized in data analysis that reduces hallucinations. would love to connect!
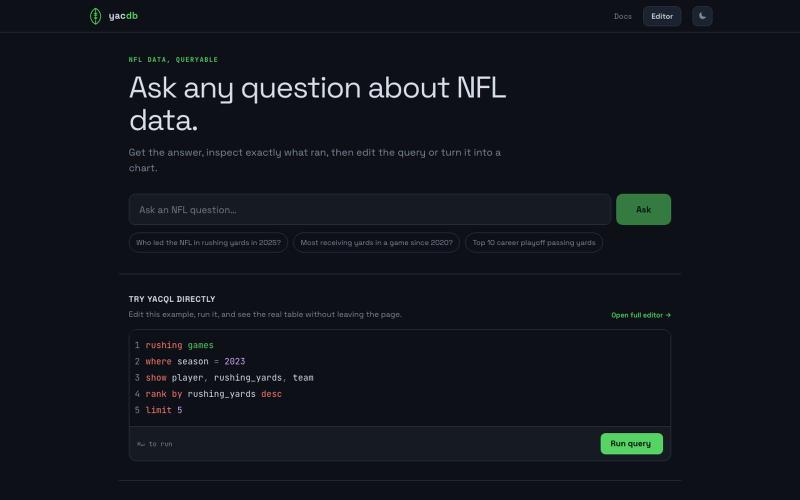
Query NFL statistics using natural language or YACQL, instantly create shareable tables and charts.
u/Fun-Calendar8486 · Reddit
I am building yacdb.fyi, letting users ask natural-language questions about NFL data and turning them into queryable results. Yacdb.fyi goal is to allow users to construct questions about NFL data, think "Best 1st down conversion rate in 2025", and exposing a custom query layer on top (think SQL) allowing users to define their own queries to build data sets. They can chart in the app, using built in tooling, but can export the data as well if they want to use their own tooling. I am look
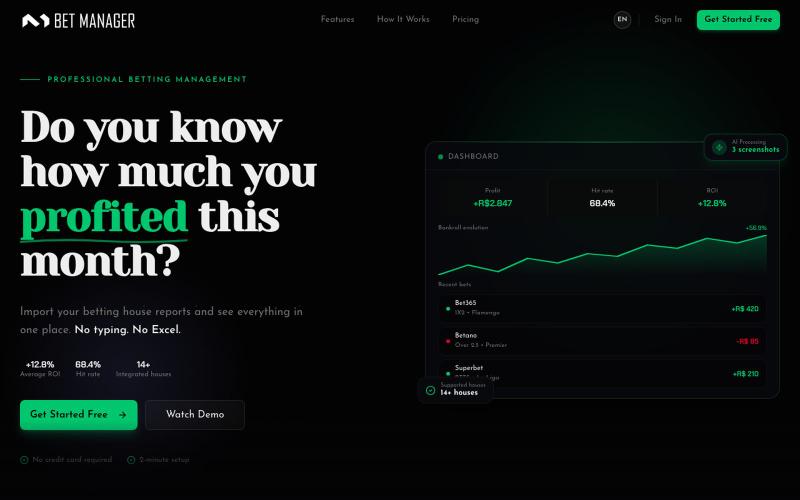
Dashboard that consolidates sports betting reports from multiple bookmakers without manual data entry.
u/Beginning-Eagle-1957 · Reddit
A coworker who likes betting told me he tracked everything in Excel. 7 months of development later, it became a SaaS. I work as a Data Analyst at a private equity bank. In January a summer intern joined who did a lot of sports arbitrage betting, placing bets across multiple bookmakers at once to lock in profit from the odds difference. I asked him how he kept track of it all, and he said it was just Excel, because nothing built for that actually existed. That idea kept nagging at me, and that
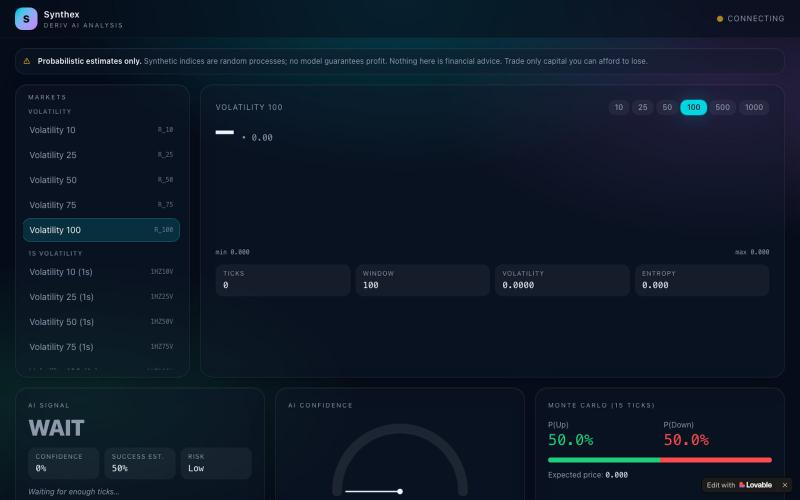
Analyze Deriv volatility and digit indices with AI-scored predictions and trade signals.
@billy_mutandari · X
Check out what I just built with Lovable!