
Finance & Business3 weeks ago
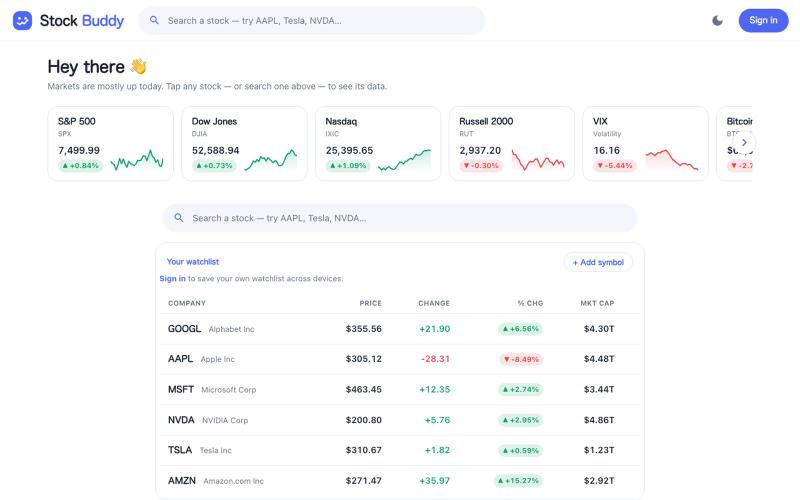
Stock Buddy
Stock analysis and portfolio tracking tool built with AI.

@jrmandell · X
Completely agree - I vibe coded my own: Check it out - would love user feedback!
The full gallery
Tech stack
60 projects
Stock analysis and portfolio tracking tool built with AI.
@jrmandell · X
Completely agree - I vibe coded my own: Check it out - would love user feedback!
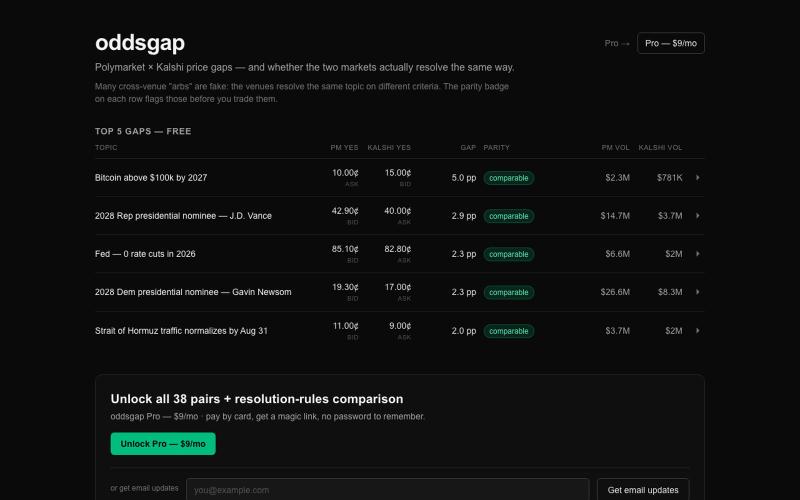
Find price gaps between Polymarket and Kalshi prediction markets to identify arbitrage opportunities.

@b1llymane · X
startup #1 of 12 this year: it catches sportsbooks pricing the same game differently, bet both sides, profit either way. mostly built between 11pm and 3am, which felt thematically correct
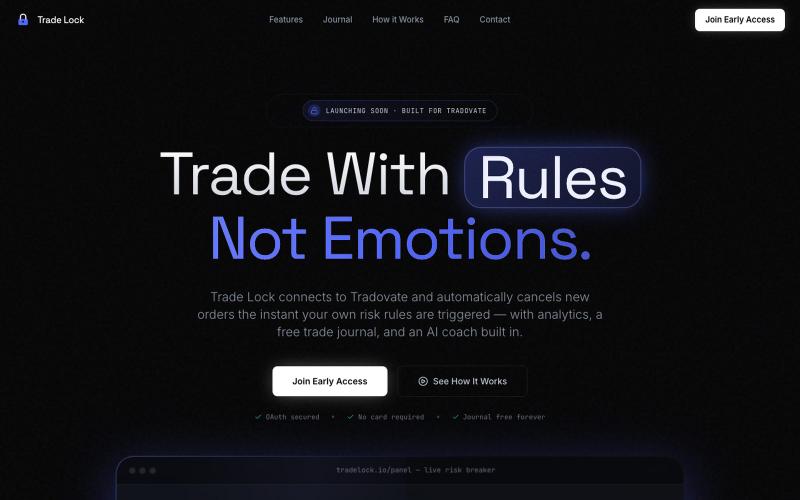
AI risk management for Tradovate that automatically blocks orders when triggered by your own risk rules.

@SanuCodes · X
still building-
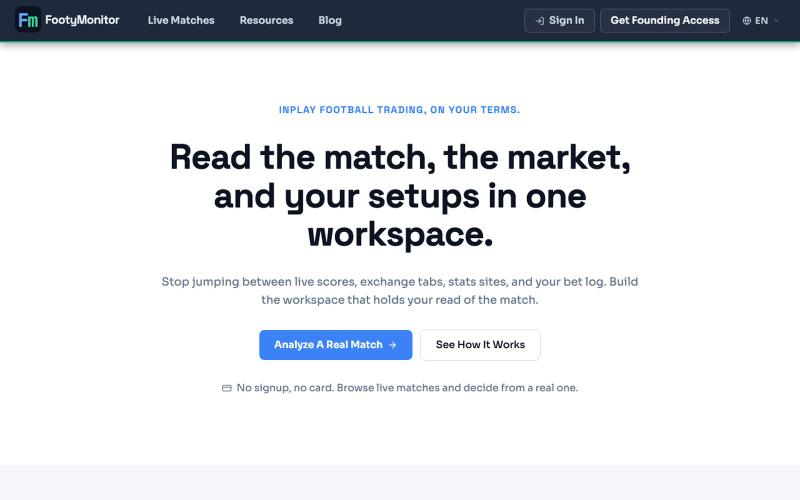
Analyze football markets with pressure graphs and backtest trading strategies.

@KSertttttttt · X
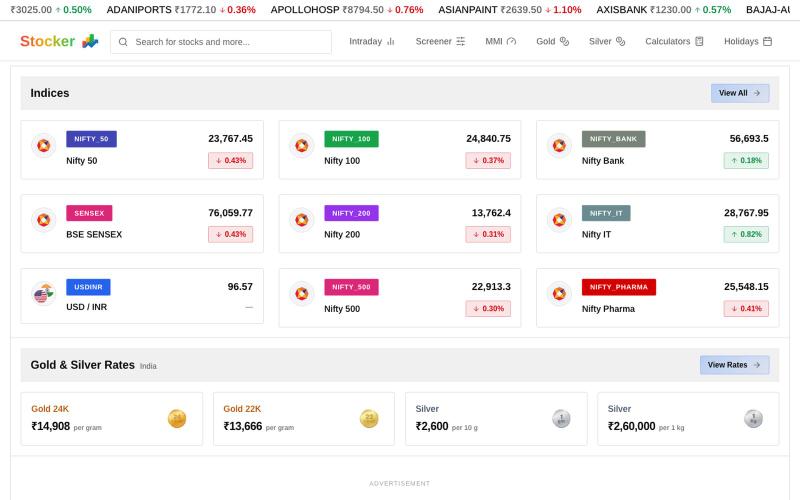
Track real-time Indian stock prices, charts, and market analysis on NSE and BSE exchanges.

@SammedChougule · X
✨ What's New in Stocker? Just shipped a major update to Stocker. This release is all about one thing: Cleaner UI. Faster insights. Better investing experience. Here's what's new 👇 #Buildinpublic #FinTech #Stocker #Softwareengineer #StockMarket
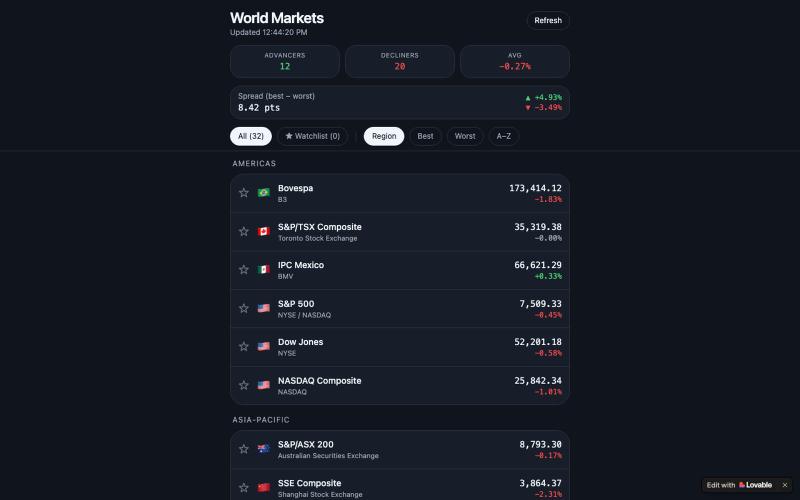
Track live performance of global stock exchanges, compare gainers and laggards, and save snapshots.

@fotohinia16520 · X
Check out what I just built with Lovable!

Test your investment discipline by replaying stock crashes day by day.
u/G1a9b9r9y · Reddit
I built a tool that shows if you would've panic-sold during a real market crash Weekend project: a test where you relive a stock's worst historical crash day by day, and decide whether to sell or hold at each point. At the end it shows how much return you'd have left on the table by panic-selling vs holding. Posted it on an Italian finance sub first — got genuinely useful feedback (turns out showing the ticker upfront made it too easy to guess the outcome), so I just shipped a v2 where the
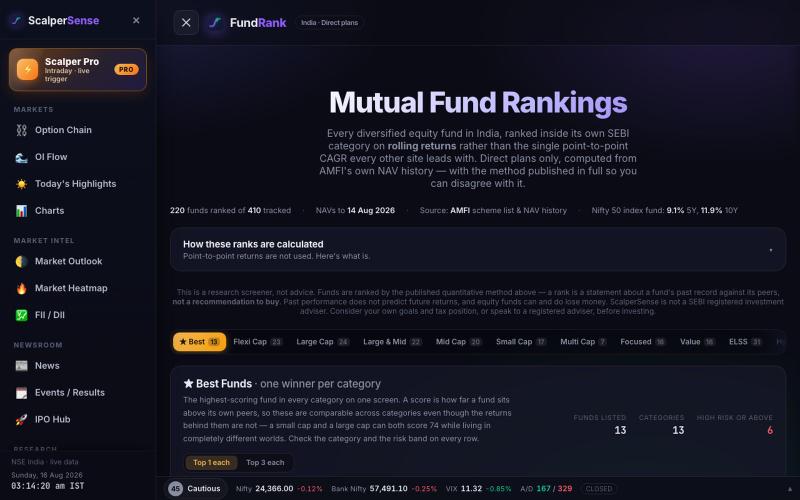
Compare ranked Indian mutual funds by rolling returns and downside risk.

@scalpersense · X
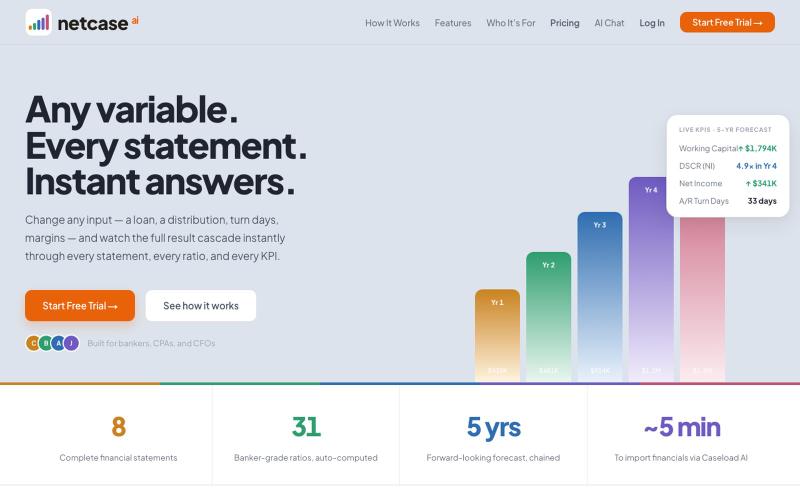
Financial forecasting and credit-analysis platform for credit professionals and business owners.

@caseyyoshi · X
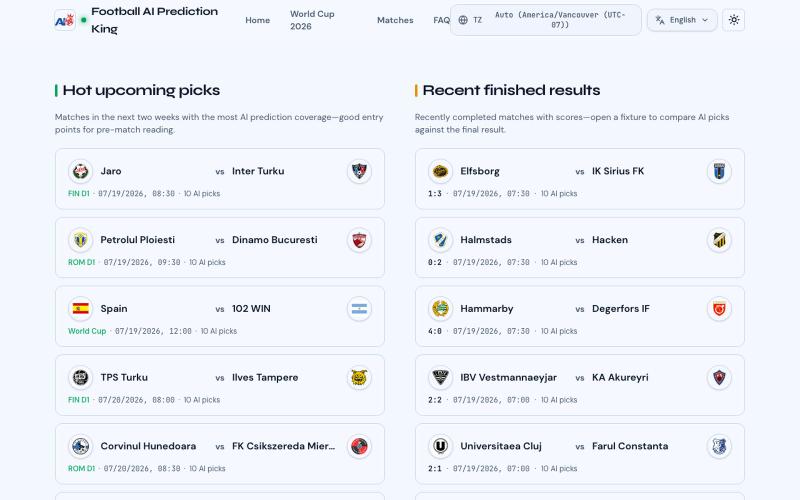
Get AI-powered predictions and match analysis for football matches across major leagues and tournaments.
footballaipredictionking · Product Hunt
Football AI Prediction King Free AI football predictions and match analysis
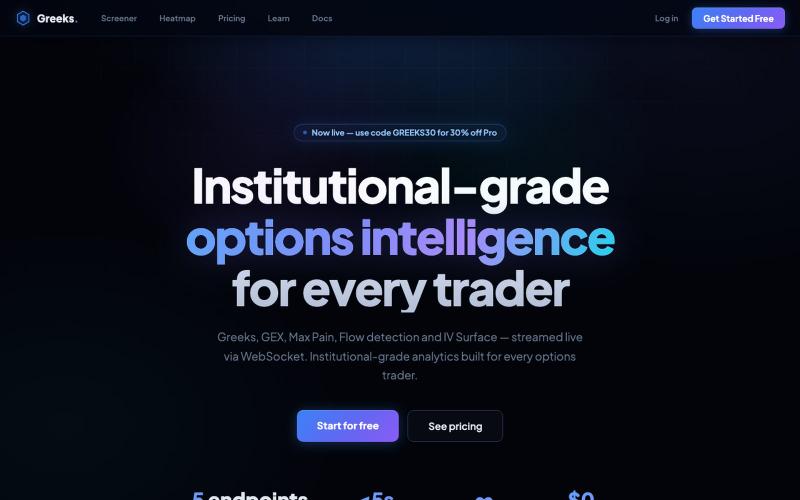
Search a stock ticker to view real-time options analytics including Greeks, GEX, Max Pain, and Unusual Flow.

@GreeksOptions · X
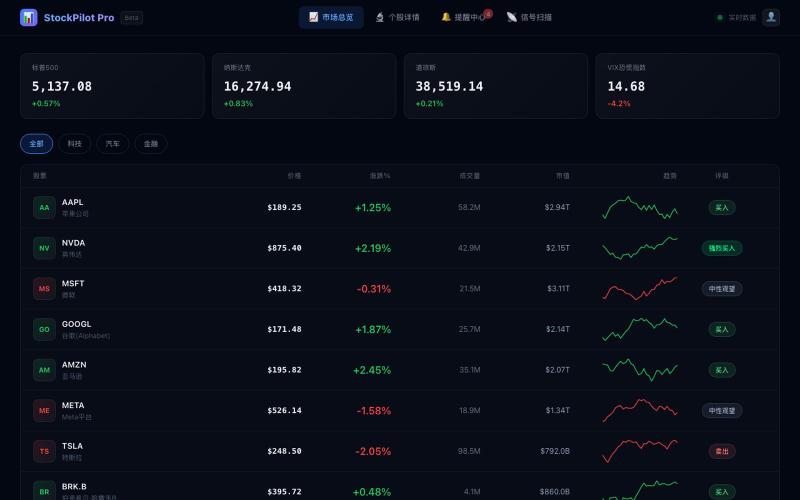
US stock trading signal platform analyzing market data to identify trading opportunities and signals.

@MEJ50749 · X
用 @dappOS_com coding 做了一个美股信号网站: 它和普通美股行情网站最大的区别是:普通网站更多是“给你看行情”,而这个网站更像一个“辅助交易工作台”。 大多数美股网站会把价格、涨跌幅、新闻、财报、K 线分散展示出来,信息很多,但用户还要自己判断: 哪只股票值得看? 现在是什么信号? 这个信号强不强? 有没有触发提醒? 后续要不要复盘? 我这个站的核心思路不是堆信息,而是把交易前的观察流程做成工具: 1. 市场总览不是单纯看涨跌 首页会把美股标的放进观察池里,比如 AAPL、NVDA、MSFT、GOOGL、AMZN、META、TSLA 等,不只是显示价格,还会结合涨跌幅、成交量、市值、PE/PB、行业、52 周区间等信息,让我先快速判断哪些票值得继续看。 2. 最重要的是信号扫描器 这个功能是普通行情站很少直接做成工作流的地方。 网站里有“智能信号扫描器”,可以扫描技术形态,并把信号归类成突破、反转、动量、超卖、超买、金叉、死叉、背离等类型。 比如: NVDA 出现强势突破、量能放大、均线多头排列; AAPL 出现 MACD 金叉、RSI 超卖反弹、布林带下轨支撑; MSFT 出现 MACD 背离,需要注意短期回调; TSLA 出现均线死叉,提示中期下行压力。 这就不是简单告诉我“今天涨了多少”,而是帮我回答一个更交易化的问题: 这只股票现在为什么值得关注,关注点在哪里? 3. 个股详情页更像交易前检查清单 普通网站的个股页往往是行情 + 新闻 + 财务数据。 我这个站的个股详情页更偏“交易前判断”:价格、评级、52 周区间、K 线/成交量、基本面、技术信号、资讯都放在一起。 它的价值是把“发现信号”之后的下一步接住。 扫描器告诉我哪只票有异动,详情页帮我进一步看这个信号有没有质量。 4. 提醒中心是我最喜欢的功能 这个站不是看完就结束,而是有 Alerts Center。 里面可以看到全部提醒、已触发提醒、等待中提醒,还能新建价格/信号提醒。 比如: NVDA 突破 900 美元触发提醒; AAPL 出现 MACD 金叉提醒; TSLA 等待成交量异常触发; META 跌破支撑提醒止损风险; AMZN 突破近期高点提醒动能增强。 这和普通美股网站最大的差异就在这里: 它不只是信息展示,而是把“观察 →