
Finance & Business1 month ago · 1 tries
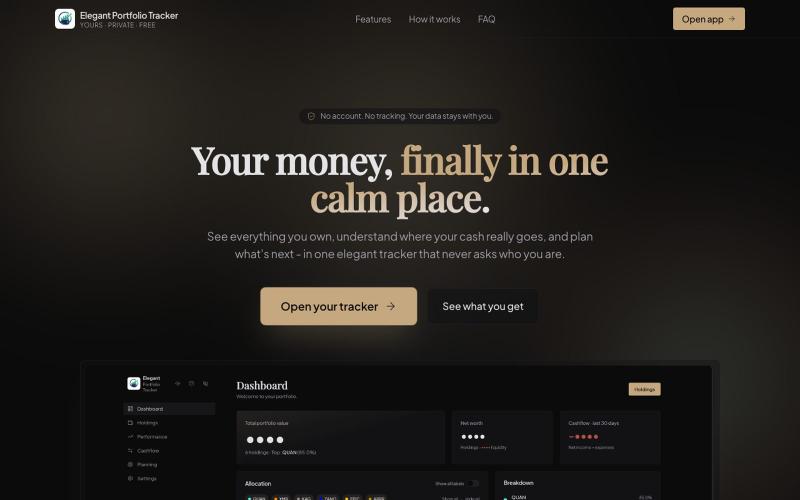
Private Portfolio Tracker - Stocks, Crypto & ETFs
Track stocks, crypto, ETFs and metals with allocation, cashflow and forecast views.

@GABRIELxCxR · X
Completely free and private finance tracker!
The full gallery
Tech stack
60 projects
Track stocks, crypto, ETFs and metals with allocation, cashflow and forecast views.
@GABRIELxCxR · X
Completely free and private finance tracker!

Track real-time profit and business performance metrics.

@uchechukwuevan · X
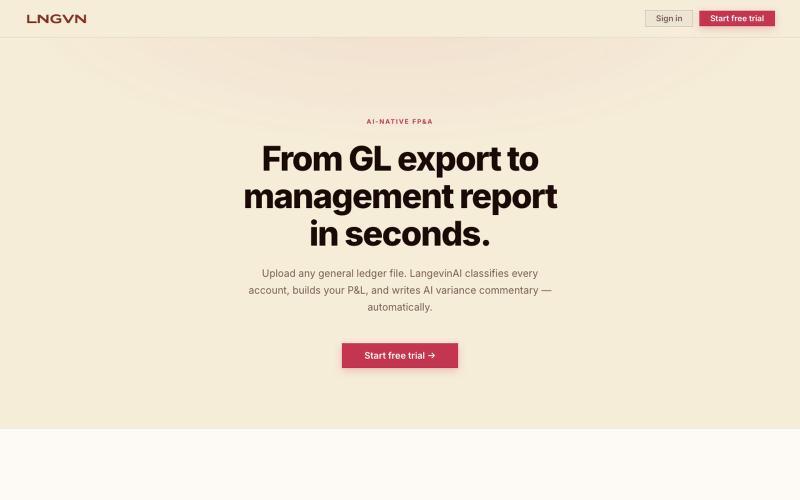
Upload GL files to auto-generate P&L reports with AI-written variance commentary.

@VictorVDPN · X

Research stocks in your own words. Free AI stock screener: describe what you want in plain English and get real public companies back, each with dated evidence from SEC filings and
soner_sensoy1 · Product Hunt
stocks-llm Natural Language Stock Research Agent
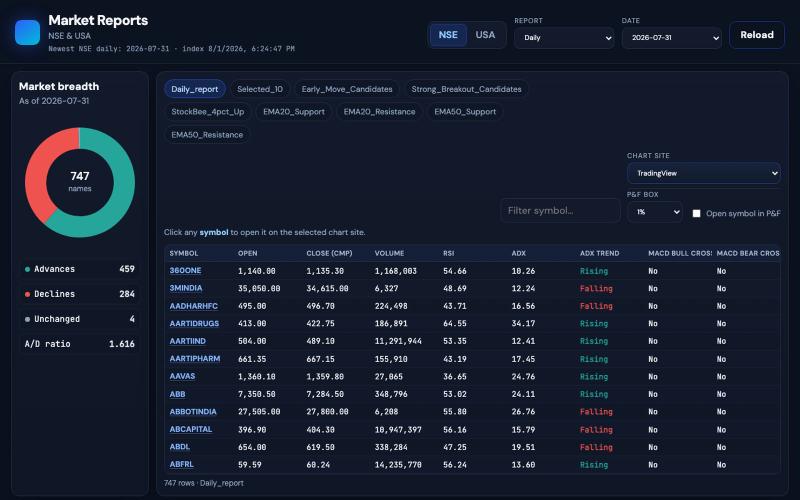
@jacobAlswin Point and figure chart US stock https://t.co/LiS8OfbhKj

@neha041187 · X
Point and figure chart US stock

Find statistical edges in Kalshi weather prediction markets with data-backed analysis.

@WingGirlTrader · X
Because the edge is in trading weather markets. And the is a free tool that provides real edge almost daily in temperature bets. And it's FREE

Get AI-powered investment research tools like DCF models and stock screening for individual investors.

@StephanInvests · X
Building a financial saas at the lowest price for people to put more towards their financial goals

Analyze NSE and BSE stocks with AI-powered insights on financials and shareholding patterns.

@justbuildingai · X
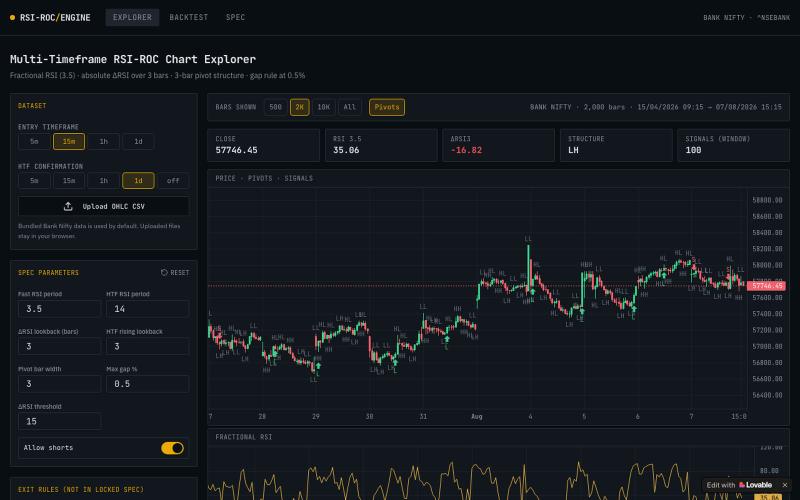
Interactive charting tool for analyzing Bank Nifty stock index with technical indicators and multiple timeframes.

@bariyaone · X
Check out what I just built with Lovable!
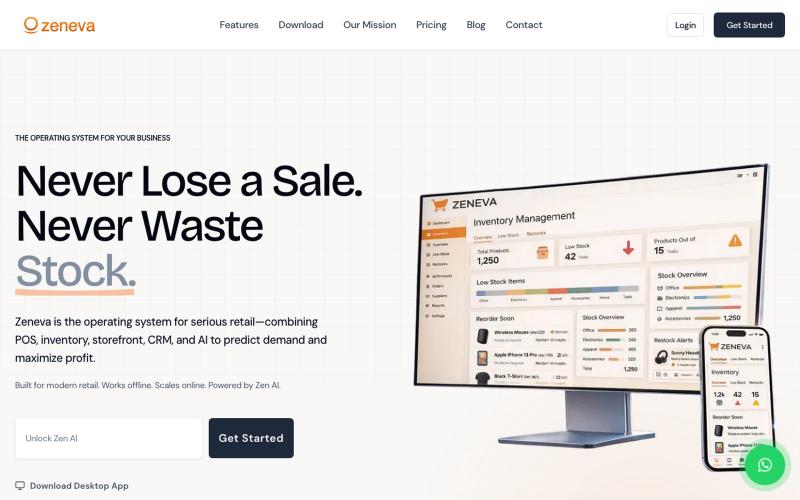
Point-of-sale and inventory system with analytics and multi-currency payment processing.

@dev_bime · X

Test your investment discipline by replaying stock crashes day by day.
u/G1a9b9r9y · Reddit
I built a tool that shows if you would've panic-sold during a real market crash Weekend project: a test where you relive a stock's worst historical crash day by day, and decide whether to sell or hold at each point. At the end it shows how much return you'd have left on the table by panic-selling vs holding. Posted it on an Italian finance sub first — got genuinely useful feedback (turns out showing the ticker upfront made it too easy to guess the outcome), so I just shipped a v2 where the
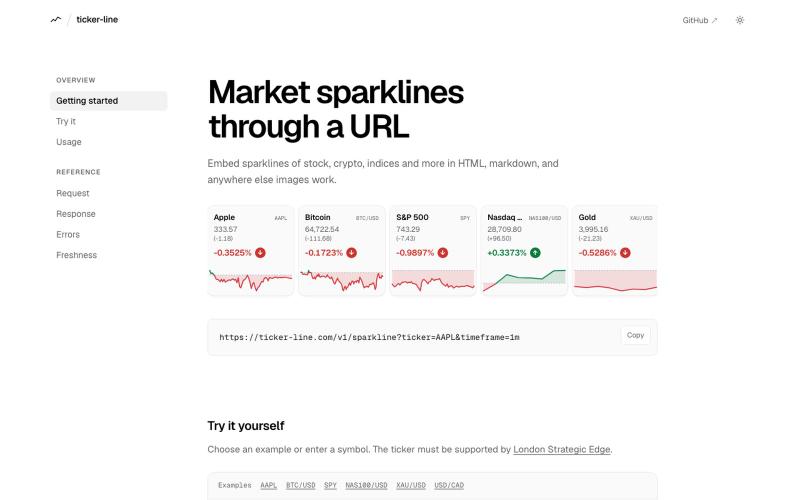
Generate embeddable market sparklines for stocks, crypto, and indices via URL.
kahtaf · HN
Ticker-line.com – embeddable market sparkline SVGs