
Developer Tools1 week ago
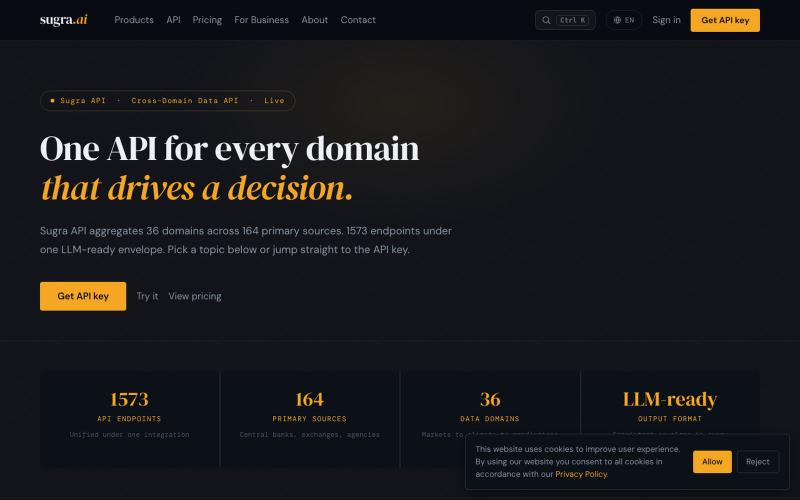
Market Data, Economics & News API - Sugra
API providing market data, economics, commodities, climate, and news in LLM-ready JSON.

@SugraSystems · X
The full gallery
Tech stack
60 projects
API providing market data, economics, commodities, climate, and news in LLM-ready JSON.
@SugraSystems · X

Manage faculty members' data, ranks, promotions, and teaching loads in academic institutions.

@FalhdirA · X
Check out what I just built with Lovable!
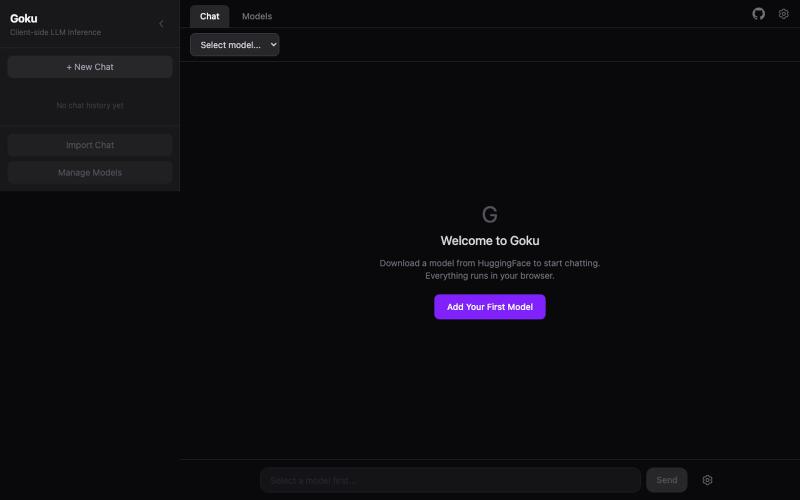
Manage and run LLM models in your browser via WebAssembly.
userfrom1995 · HN
Goku – WASM (wllama)-powered LLM inference and model manager
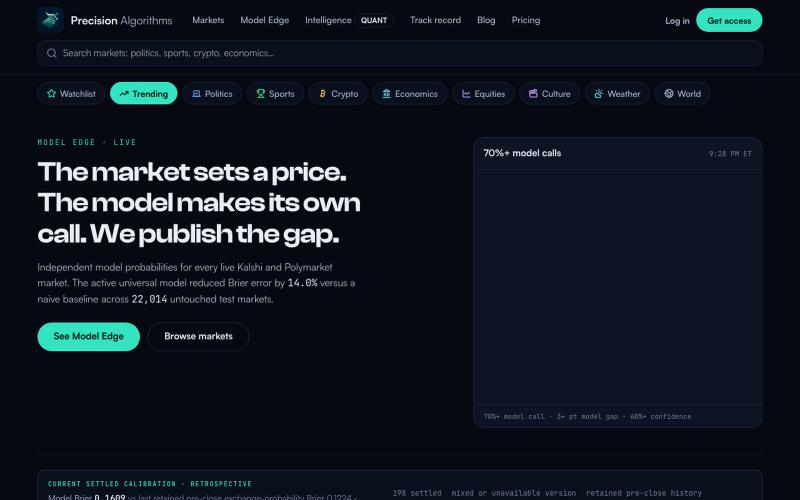
View ML model predictions for Kalshi and Polymarket markets with performance metrics.

@precisionalgo · X
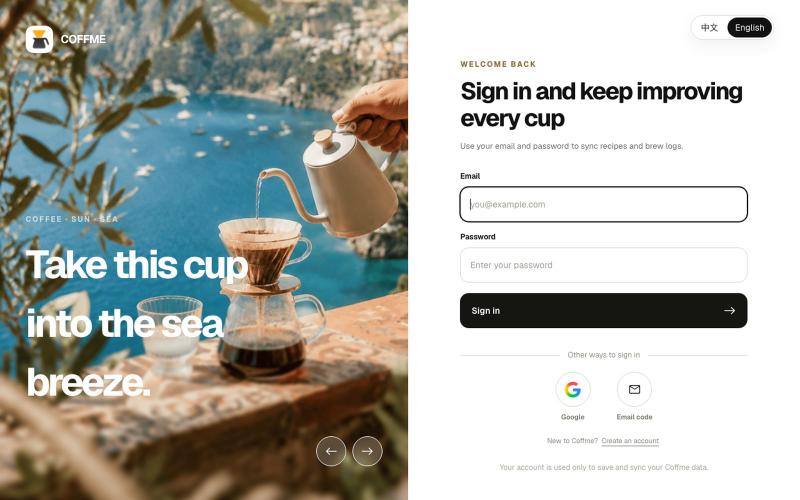
Record and optimize pour-over coffee recipes with brewing guides, flavor tracking, and data analysis.

@nathantong416 · X
我做了一个为手冲咖啡爱好者设计的记录工具。 从配方整理、冲煮引导,到风味记录与复盘,帮助你找到真正适合自己的那杯咖啡: • AI 配方识别 • 60+ 冲煮方法 • 滤杯管理 • 冲煮记录与数据分析 欢迎尝试并提供意见~ #coffee #vibecoding #手冲咖啡
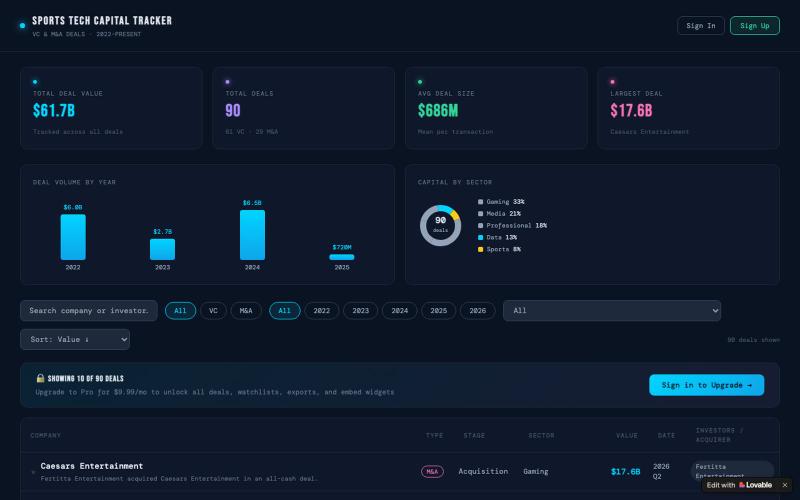
Track investment opportunities and deal flow in sports technology ventures.

@Stemack · X
I vibe coded a sports capital tracker…would love your thoughts.
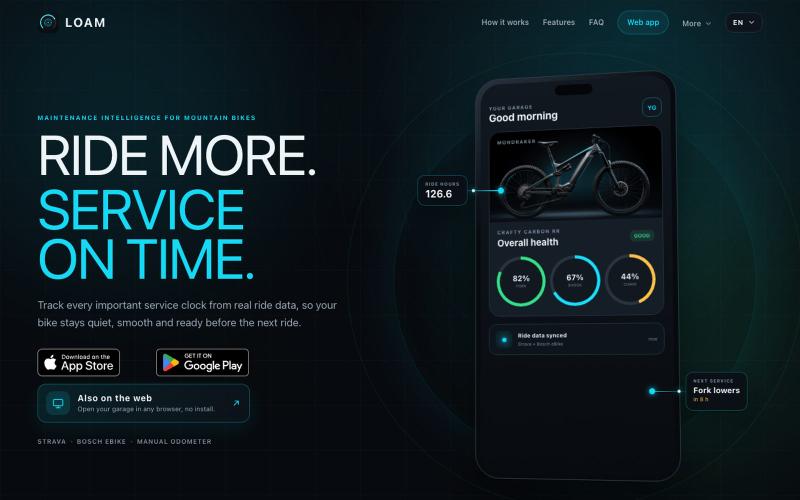
Connect Strava or your bike odometer to track service intervals.

@GadgetsCars · X
Built a mountain-bike service-tracker with no accounts and no server-side data nothing to breach, I don't have your data. Garage stays on-device, cloud backup is encrypted on your phone before it leaves. Built with Claude behind a strict test+CI gate.
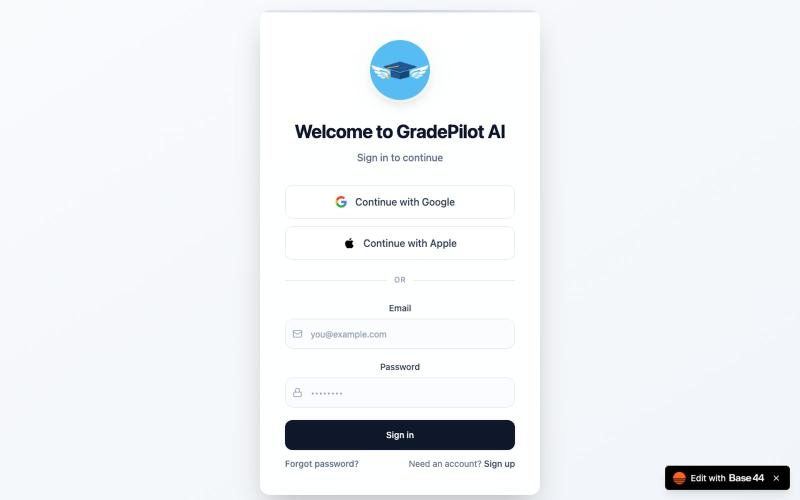
Track CGPA, organize study materials, and manage academic work for individuals and teams.

@ekene_ogbuagu · X
Working on An Nigerian University-based Education Operating System, where students can calculate and track their CGPA and also study😌🔥

A visualization language designed for AI agents to create and interact with charts.
chenglong-hn · HN
Data visualizations are the bridge between user and data. But building AI agents that can generate visualizations reliably can be very tricky: - simple chart specs can be reliable, but generated charts are often of low quality due to reliance on system defaults; - complex chart specs with explicit details can produce good-looking charts, but they are verbose and agents can struggle with reliability We figured out it is a limitation on the language issue (not just AI capability thing) -- current visualization languages are a bit too low-level for AI agents, requiring them to explicitly make visual decisions that are supposed to be handled by a good compiler. Flint is a visualization intermediate language to address this issue, allow AI agents to solve this last-mile human-agent interaction problem. It provides a simple semantic-type based specification, and contains a layout optimization engine that can produce good-looking charts (filled with derived low-level details) from simple
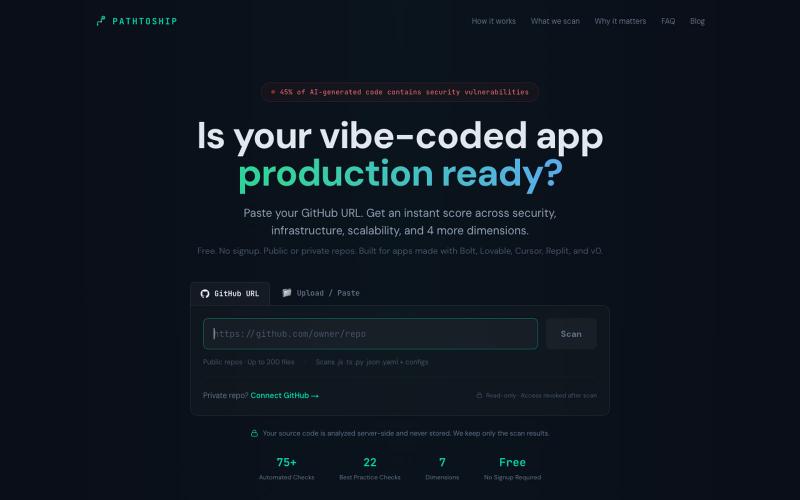
Scan your GitHub repo for production-readiness across security and scalability.

@nathanghart · X
Submitting for approval. I built a free tool for anyone about to ship a vibecoded app. It scans your repo for what bites you in prod (leaked keys, no auth, no error handling). I ran it on 1,868 AI-built apps and even caught my own scanner being ~42% wrong.
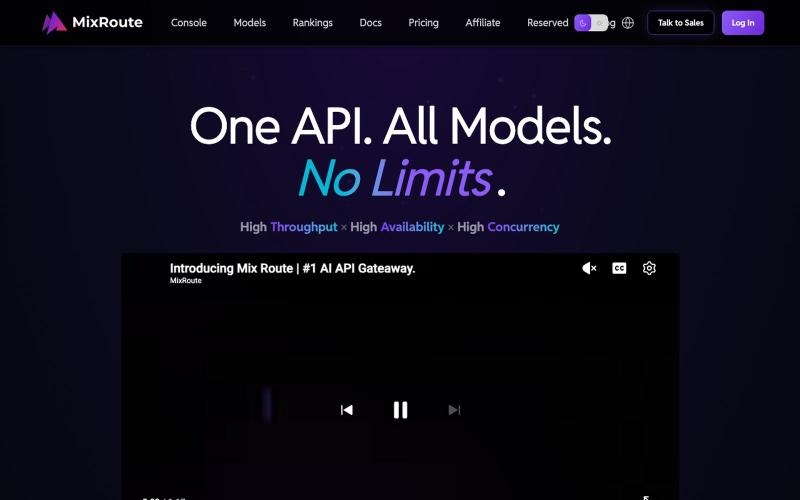
One unified API to access 200+ AI models including Claude, GPT, and Gemini with auto-failover.

@MixRoute_ai · X
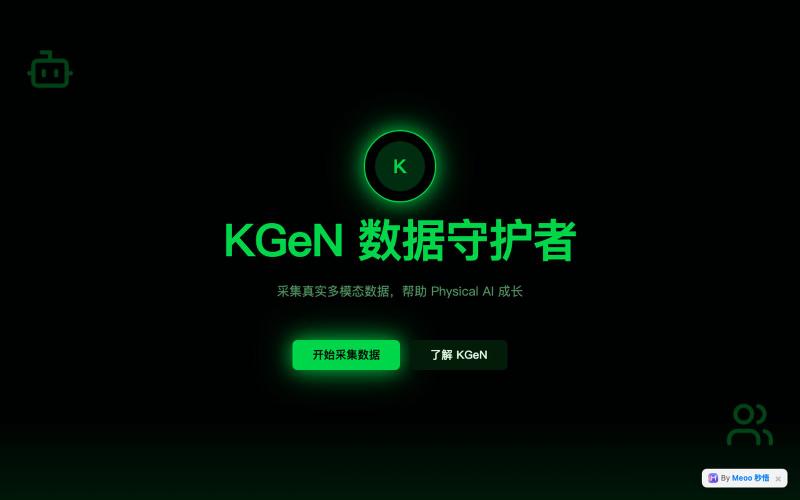
Click to collect multimodal data and beat AI bots for points in this data-gathering game.

@Ali363214029593 · X
“玩了 1 分钟就上瘾!🟩 我用秒悟做了一个 KGeN 主题小游戏《KGeN 数据守护者》: 点击真人收集真实多模态数据(声视动触),打 bot 赚分数,集齐还触发烧币特效! 61.9M 真实人类数据守护 Physical AI,就从这个小游戏开始~ 快来玩!贡献你的数据吧 @KGeN_CN