
Other3 weeks ago
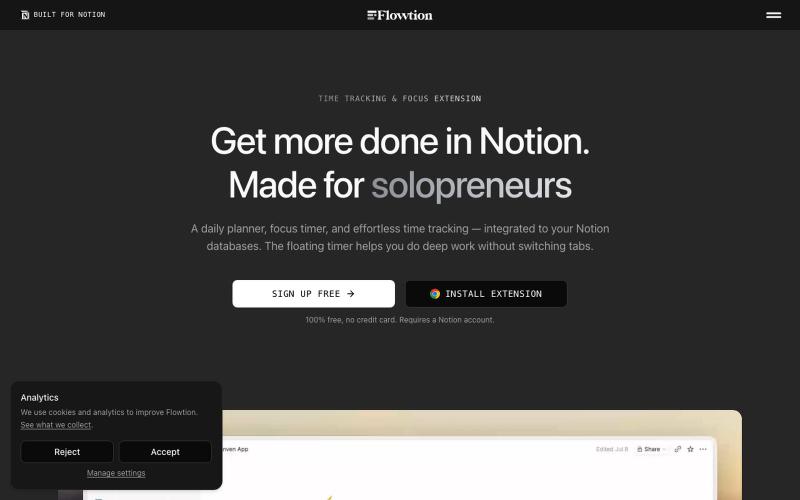
Flowtion – Time Tracking & Focus, Built for Notion.
A daily planner, focus timer, and effortless time tracking — integrated to your Notion databases.

@origin_alin · X
The full gallery
Tech stack
60 projects
A daily planner, focus timer, and effortless time tracking — integrated to your Notion databases.
@origin_alin · X

A 90s pixel arcade slot machine that generates random creative design briefs. Pull the lever.

@Gazalisapuzzle · X
BriefPot — a creative block ender for designers. Get random design briefs when you’re staring at a blank canvas with no idea what to make. And if you’re bored between projects, there are mini-games too. Pull the lever. Get a brief. Start designing. 🎰

Tools for analyzing your skin type, hydration levels, ingredients, and hair porosity.

@Hyaluflow · X
We’re building HyaluFlow 🚀 Free tools like a Skin Type Analyzer, Ingredient Checker & Hydration Calculator. Which tool would you actually use?
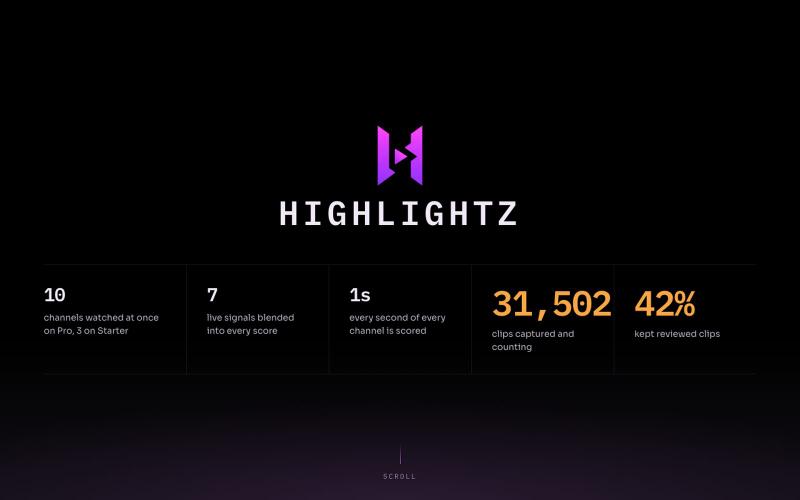
Monitor up to 10 Twitch channels and automatically create clips based on chat activity and audio.
u/Financial-Working797 · Reddit
Was a clipper, Wanted a clipping bot, Built one! I started clipping channels about a year or so ago when I had a little more free time. Eventually I got a full time job and I can no longer be watching streams because I obviously do not have the time. I decided to create a clipping bot instead. I started with crafting a formula rather than AI because I think AI is sloppy and misses out where a formula is sound proof. Results were okay so I started adding different factors into the formula. I
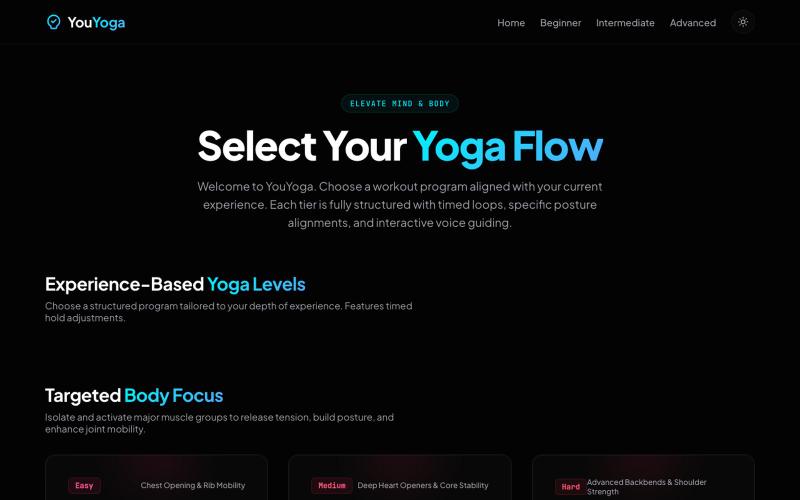
Guided yoga sessions with beginner to advanced routines and text-to-speech voice instructions.

@shivanshsh1823 · X
you yoga a day - to - day workout routine for yoga
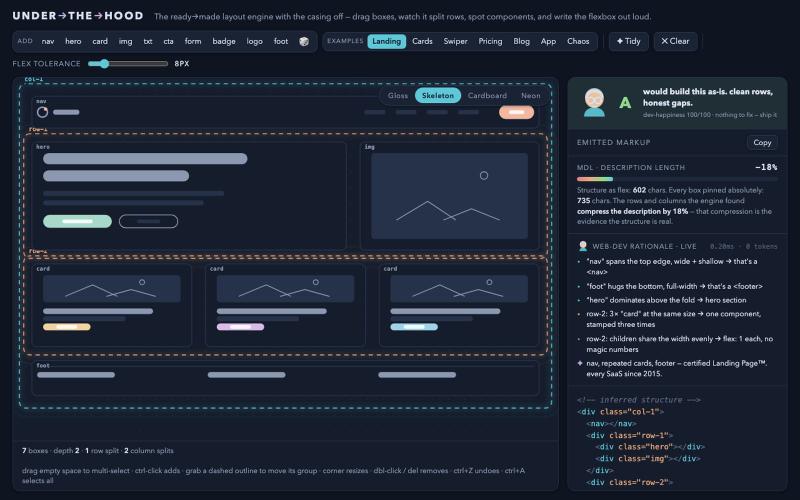
Drag boxes to visualize how a Flexbox layout engine infers constraints.
drzivil · HN
Drag boxes around and watch a layout engine infer the Flexbox (no AI)

Finds optimal car washing times based on weather conditions and tracks vehicle maintenance.

@Sensha_biyori · X
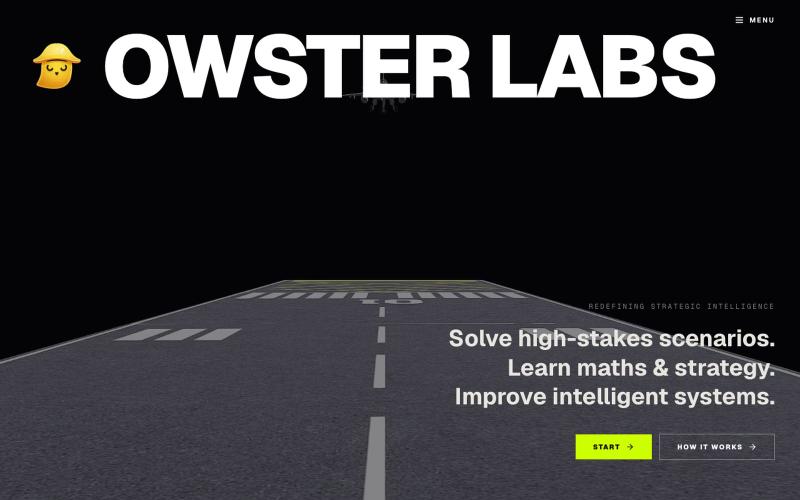
Learn math and physics through cinematic missions and interactive physics simulations.

@electricdrago10 · X
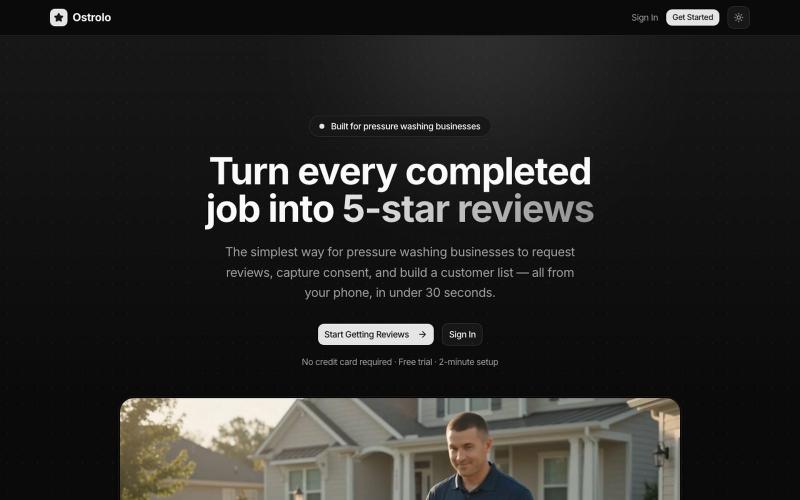
The simplest way for pressure washing businesses to get more Google reviews and build a permission-based customer list.

@brian_flp · X
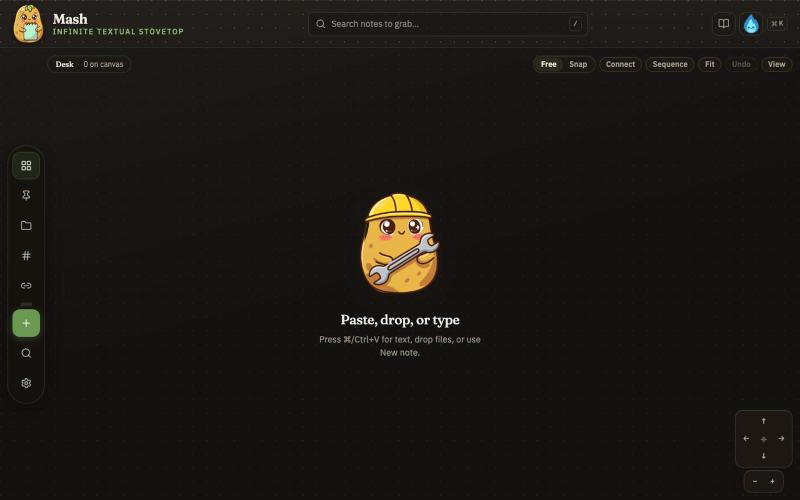
Combine notes on an infinite canvas and export sequences as PDF pages.

@JonnyD · X
I'm happy to announce "Mash" A local first browser based app for compiling notes and ideas on an infinite canvas. Make as many notes as you want, drag and drop to "Mash" them by combining. Create "sequences" that allow you to export a pdf with each sticky as it's own page. Drop in PDF or DocX or images to easily browse the file and select your favorite clippings to a new canvas, and manipulate them or export them how you want to. Drop a GIF to get all the individual frames. Mash features a roster of cute food themed mascots because this is your infinite textual stove top. Pull in some ingredients, mash them together, stitch them together, arrange them into a flow chart, whatever you find useful, and then get out quickly. Mash is for the little moments that speed up work, and the spontaneous thoughts that inspire new directions. There is no fancy AI feature, no data collection, no login, just a utility for you. Free open source licence. Run it offline if you want
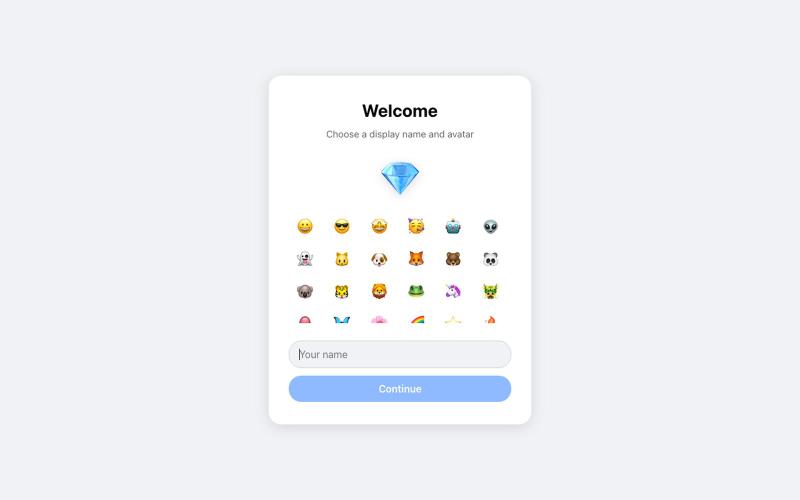
Real-time messaging powered by Cloudflare Durable Objects

@DIYregistry · X
If anyone tries to clone this repo and runs into a problem, send a message to me on I was vibe coding when I made this work & luckily created a README file. Otherwise, I'd have a hard time remembering how to repeat the steps coding a custom business email.
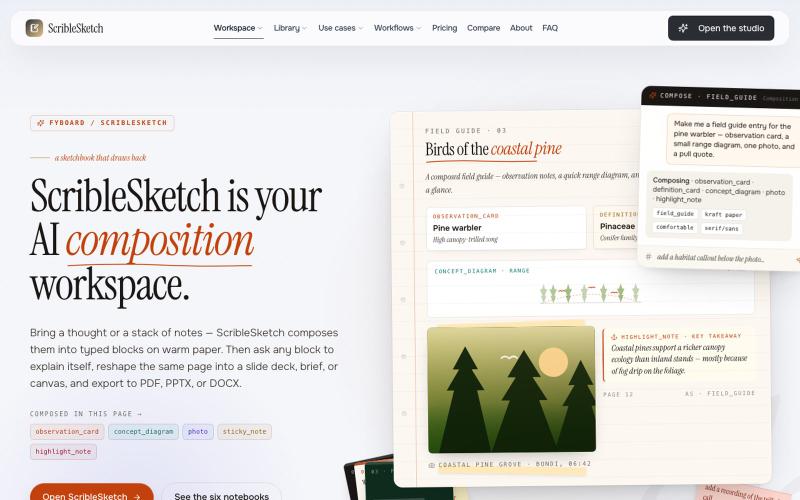
Write once, export to notebooks, slides, PDFs, PPTX, DOCX, or canvas.

@mr_wickedhacks · X
Write the doc once → get a notebook, slide deck, canvas, or resume from the same source. No rewriting for every format.