
Utilities1 month ago
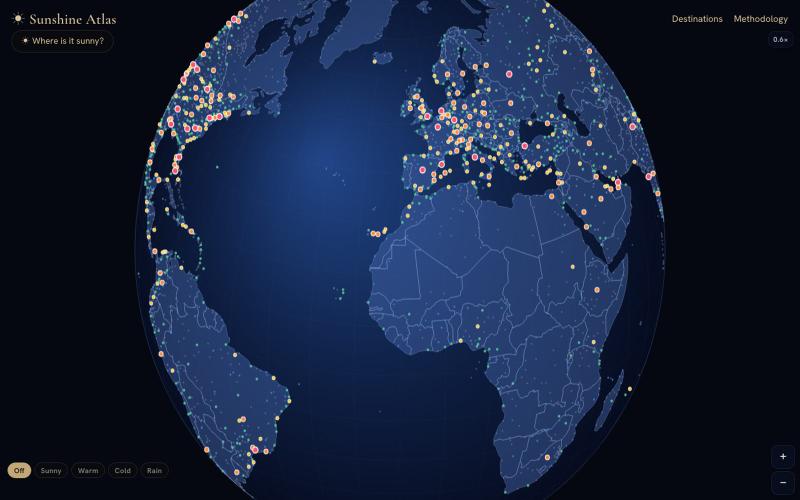
Sunshine Atlas — interactive map of the world's sunshine, warmth & rain
Interactive globe showing the world's sunniest, warmest, and rainiest places.

@Flightmussy · X
The full gallery
Topics
Known attributes
A lens, not a filter — shows only projects we could confirm.
Tech stack
583 projects
Interactive globe showing the world's sunniest, warmest, and rainiest places.
@Flightmussy · X
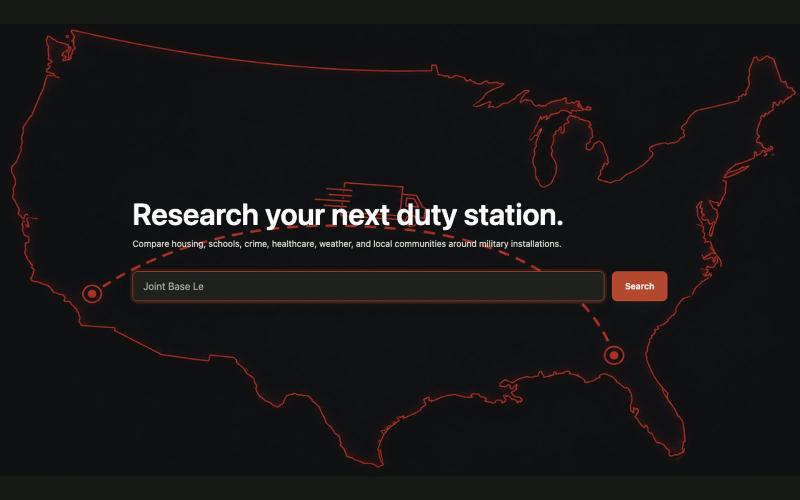
Look up crime, schools, and costs for military bases to help plan your move.

@jusDiggingholes · X
Not really a saas or startup. Retired military here. We get moved a lot. Making a site for military or retirees to get a good snapshot of their next or last base area: Crime. Schools. Costs etc.
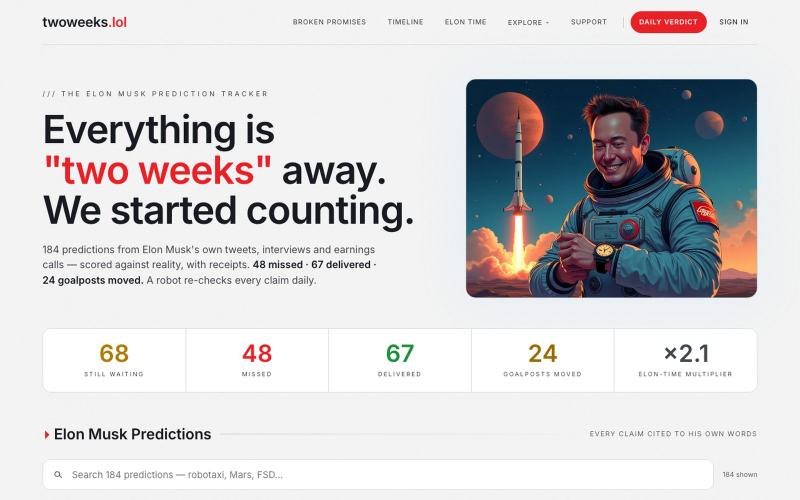
Browse and score Elon Musk's predictions to track which ones came true.

@HowardYHuang · X
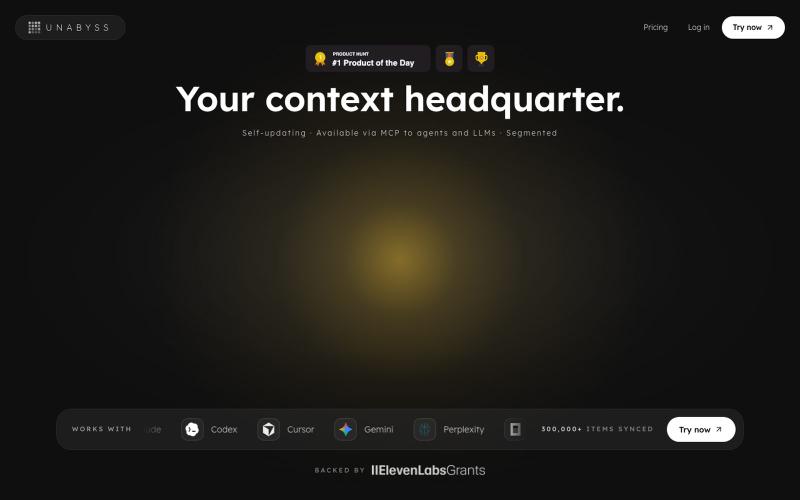
Unified context layer for AI agents that integrates email, drive, Slack, Notion, and GitHub.

@marcin_u2 · X
-> here it is! claude finally knows everything gpt knows. and both of them know everything that's happened across your email, drive, slack, notion, github and granola :)
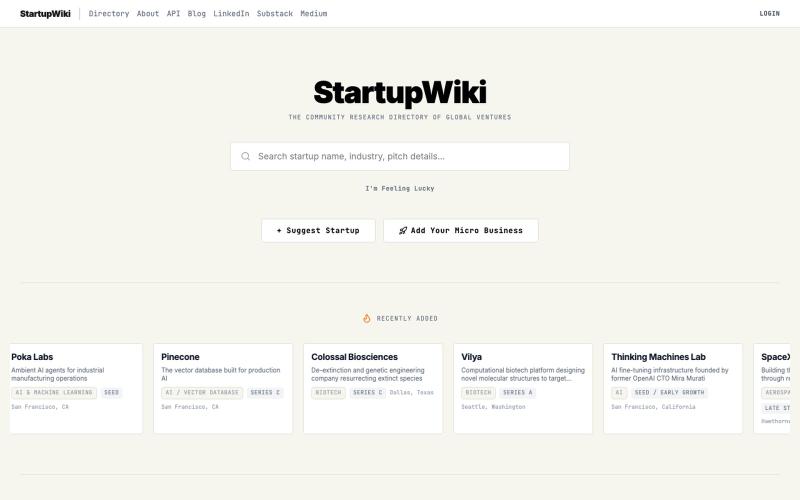
Search and explore an AI-powered directory of startups across industries like Biotech, FinTech, and CleanTech.

@StartupWiki2 · X
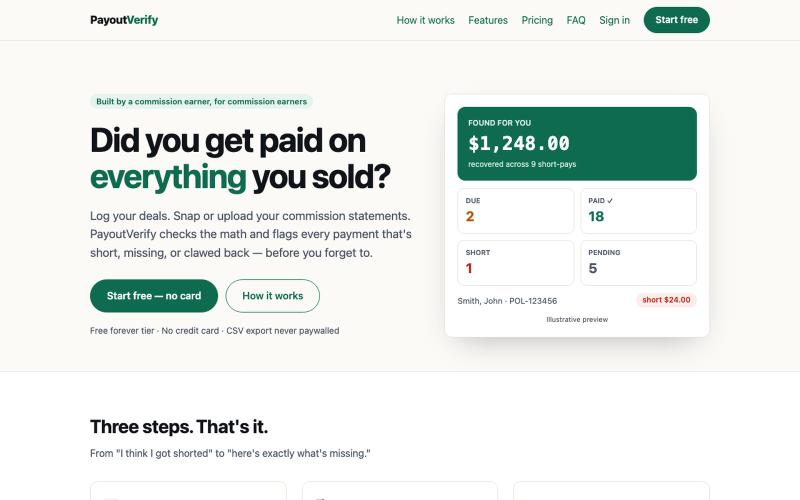
Track commission payments and flag when payouts are short, missing, or clawed back.
u/JustinMoose · Reddit
I built an app that flags when commission earners get underpaid, unpaid, or clawed back I sell insurance for a living, and a while back I realized I had no real way to know whether the carriers actually paid me correctly. You bind a policy, and 30-60 days later some commission shows up on a statement, and you just kind of trust the number. Across hundreds of policies and a few carriers, that's impossible to track in your head. So I built PayoutVerify. You log what you sold and what you expe
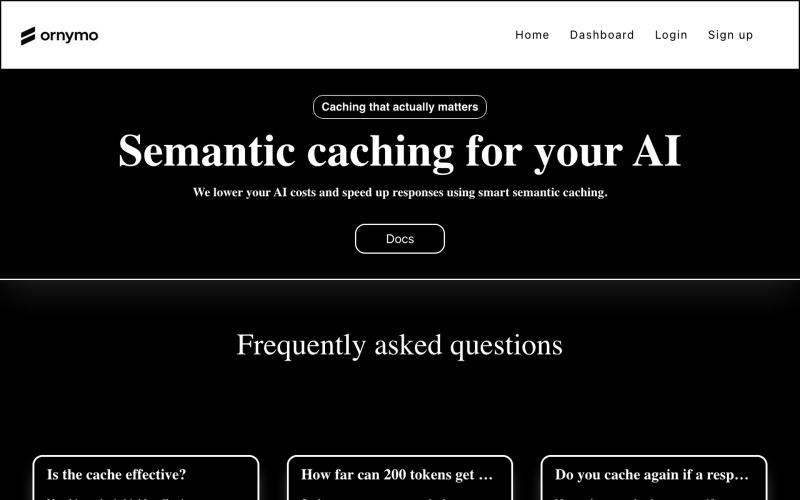
Semantic caching reduces LLM token costs and latency for AI queries.
u/ornymo_official · Reddit
how to reduce ai costs there are lots of way to reduce costs but there all complex to setup i know this cause i tried one in production so i built ornymo we cache meaning not the exact string allowing us to give same awnsers thus reducing llm costs and latency check it out at ornymo.com free for a limited time and let me know your feedback submitted by /u/ornymo_official to r/buildinpublic [link] [comments]
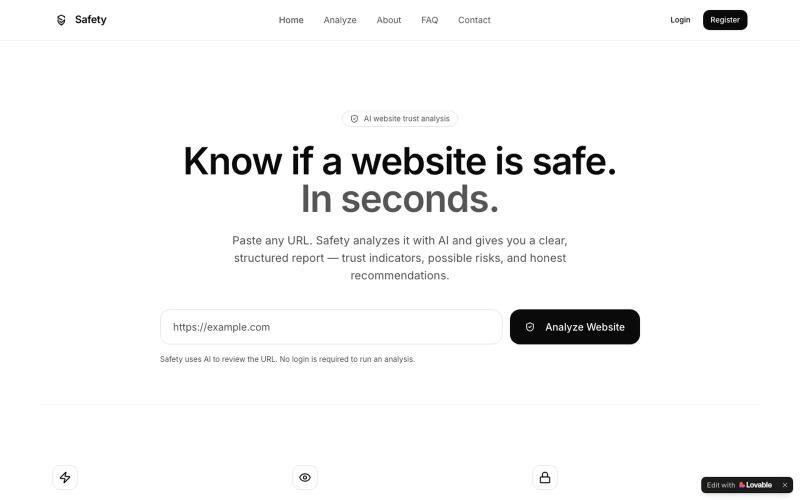
Analyze any website URL to get a trust and safety report in seconds.

@Mahmoud525258 · X
Check out what I just built with Lovable! Safety is an AI-powered website analysis platform designed to help people make smarter and safer decisions before visiting or trusting any website.
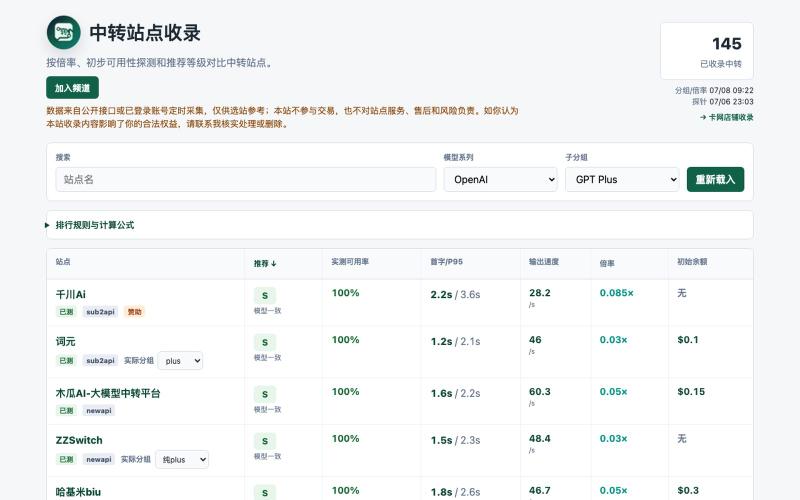
Directory comparing relay services with exchange rates, initial credits, available groups, and performance data.

@mutou1852 · X
做了一个中转站点收录网站,展示倍率、初始额度、可用分组和实测性能数据。 希望帮大家更快找到适合自己的站点。
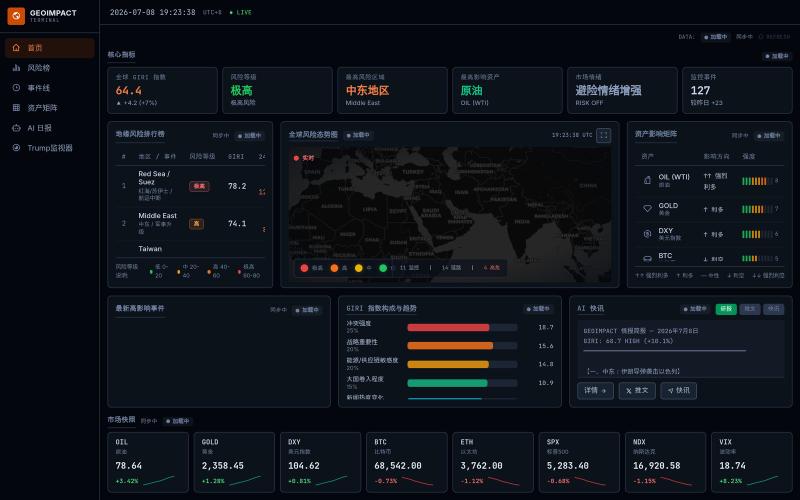
Observe geopolitical and geographical information on interactive maps

@oyoovi · X
做了一个地缘信息观察的网站,供大家免费使用: 首页基本要素综合
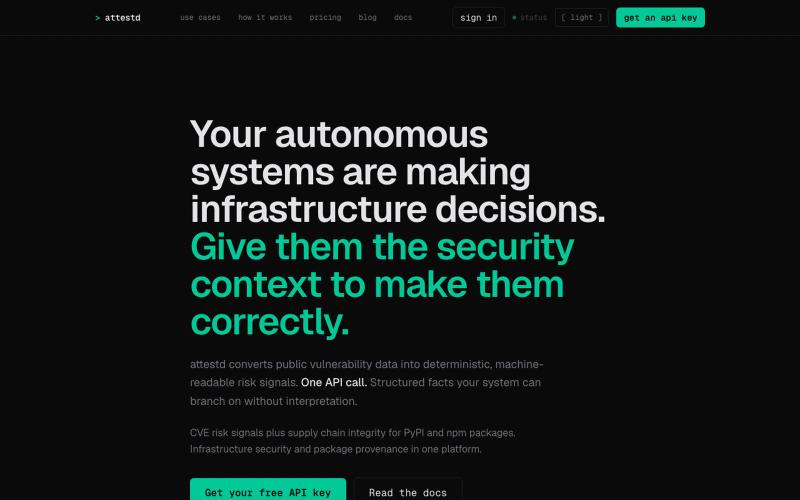
Converts CVE vulnerability data into machine-readable risk signals for security automation.
robert_marshall5 · Product Hunt
attestd CVE and supply chain risk signals for autonomous AI agents.

A visualization language designed for AI agents to create and interact with charts.
chenglong-hn · HN
Data visualizations are the bridge between user and data. But building AI agents that can generate visualizations reliably can be very tricky: - simple chart specs can be reliable, but generated charts are often of low quality due to reliance on system defaults; - complex chart specs with explicit details can produce good-looking charts, but they are verbose and agents can struggle with reliability We figured out it is a limitation on the language issue (not just AI capability thing) -- current visualization languages are a bit too low-level for AI agents, requiring them to explicitly make visual decisions that are supposed to be handled by a good compiler. Flint is a visualization intermediate language to address this issue, allow AI agents to solve this last-mile human-agent interaction problem. It provides a simple semantic-type based specification, and contains a layout optimization engine that can produce good-looking charts (filled with derived low-level details) from simple