IdeaPanda: Find business ideas worth building.
Score business ideas on market viability, competition, and demand.
@buildwithmaya · X
Hi Rashka I am building
The full gallery
Tech stack
60 projects

Score business ideas on market viability, competition, and demand.
@buildwithmaya · X
Hi Rashka I am building

Track time, manage projects, and organize clients with AI-powered workspace.
@baptistedulac · X
time tracking for freelancers and agencies

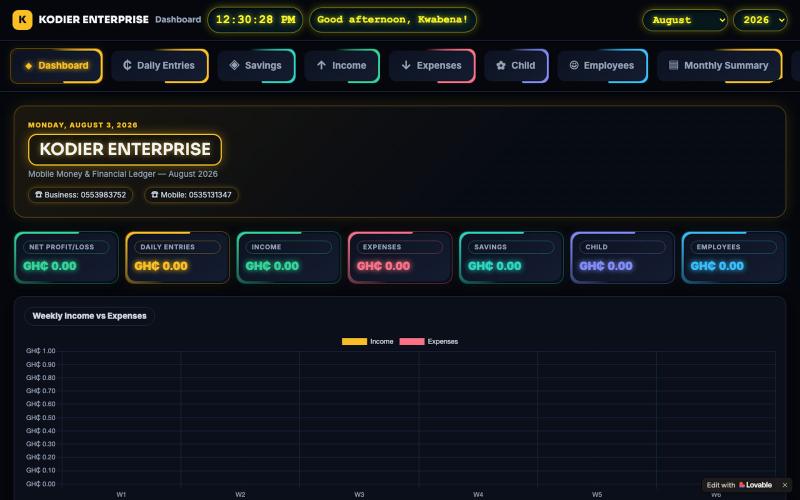
@joovier_ https://t.co/keG2Rl4hD4 data analysis app. Check out
@MourynCher16712 · X
data analysis app. Check out

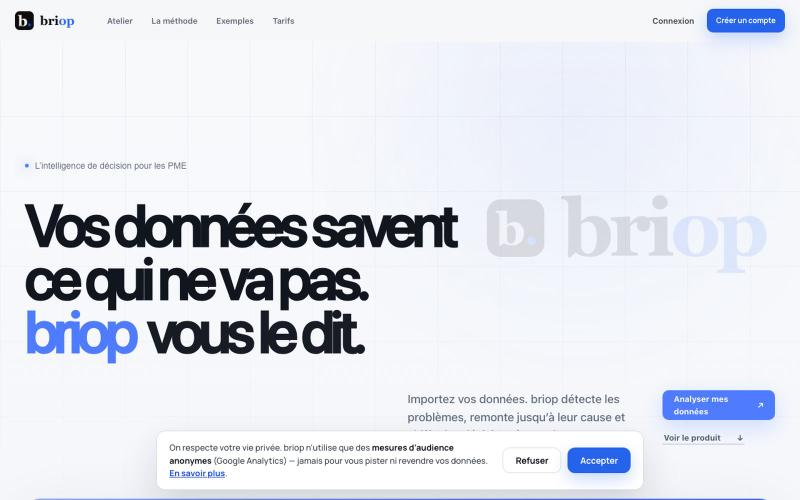
Analyze Shopify and DTC sales data to find hidden profit leaks by SKU.
@okiela_io · X
Sales up but profit unclear? I help ecommerce sellers find hidden profit leaks by SKU. Send me 1 order export → 3 leaks:

Inventory intelligence platform that helps D2C brands detect stockout risks and dead stock.
@heydevottam · X
I'm building EVE — an inventory intelligence platform that helps D2C brands detect stockout risks, dead stock, and profit leakage before they become costly.

Create animations and motion graphics with layer-based timeline editing and node-based compositing.

DevOps learning roadmap with structured topics, hands-on projects, and interview questions.
@uday_devops · X

React library with 60+ scroll-driven section transitions for modern websites.
@itz_sayan_03 · X
Ever wondered how cinematic scroll-driven websites are built? 👀 Meet SectionFlow—an open-source React library with 60+ ready-to-use section transitions, a one-command CLI, reusable sections, and optimized performance. 🚀

Centralize customer feedback, prioritize with public voting, and share interactive product roadmaps.
@himanshu_b20 · X

A visualization language designed for AI agents to create and interact with charts.
chenglong-hn · HN
Data visualizations are the bridge between user and data. But building AI agents that can generate visualizations reliably can be very tricky: - simple chart specs can be reliable, but generated charts are often of low quality due to reliance on system defaults; - complex chart specs with explicit details can produce good-looking charts, but they are verbose and agents can struggle with reliability We figured out it is a limitation on the language issue (not just AI capability thing) -- current visualization languages are a bit too low-level for AI agents, requiring them to explicitly make visual decisions that are supposed to be handled by a good compiler. Flint is a visualization intermediate language to address this issue, allow AI agents to solve this last-mile human-agent interaction problem. It provides a simple semantic-type based specification, and contains a layout optimization engine that can produce good-looking charts (filled with derived low-level details) from simple

Classify AI systems and generate EU AI Act compliance documentation for SMEs.
@Moha__niang · X

Explore a 3D showcase of AI agent orchestration with real-time project health metrics and live logs.
@patologico · X