
Productivity2 months ago
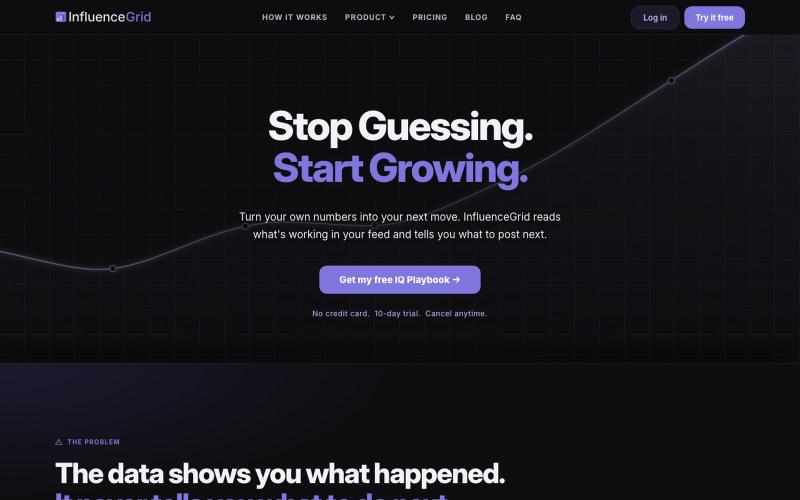
Social Media Content Playbook & Analytics for Creators and Brands | InfluenceGri
Scores your social media content, analyzes competitors, and recommends what to post next across platforms.

@InfluenceGridIQ · X
The full gallery
Tech stack
60 projects
Scores your social media content, analyzes competitors, and recommends what to post next across platforms.
@InfluenceGridIQ · X
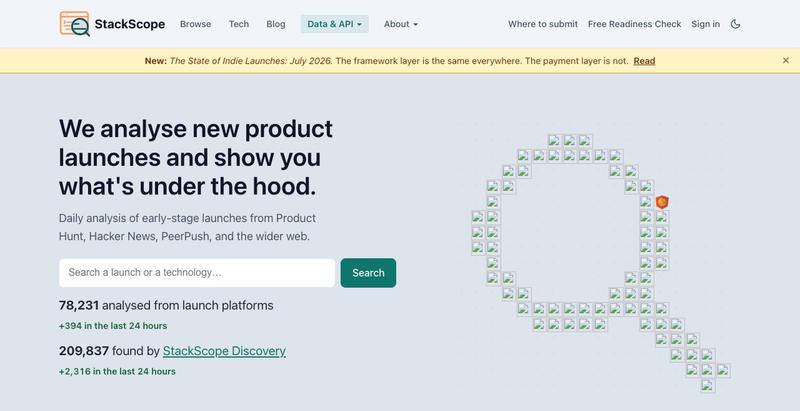
Analyze any website's tech stack to identify frameworks, hosting, and detect AI-built sites.

@stackscopedev · X
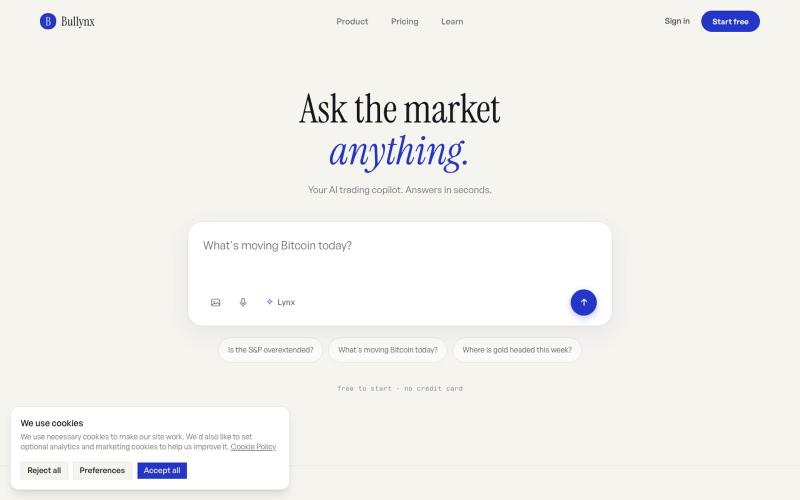
Upload charts to receive AI-powered market analysis with suggested trade levels and insights.
u/famelebg29 · Reddit
i built an ai that reads chart screenshots and tells you what it actually sees, looking for honest feedback so for the past few months i've been building an ai trading copilot. the idea came from watching people (me included) screenshot charts and send them to friends asking "what do you think?". i figured that exact motion, screenshot in, opinion out, was the whole product. you upload any chart screenshot, stocks crypto forex whatever, and it gives you a structured read. where support and
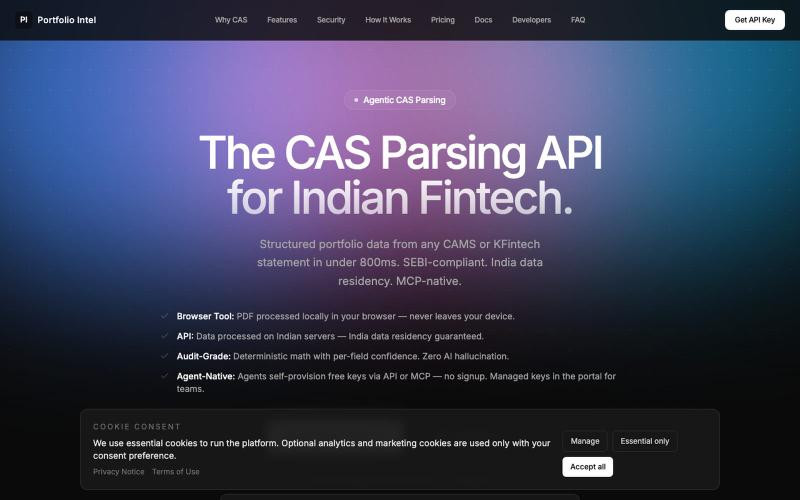
Upload a CAS PDF to get AI portfolio analysis with benchmark comparisons and allocation insights.

@iASHeeesh · X
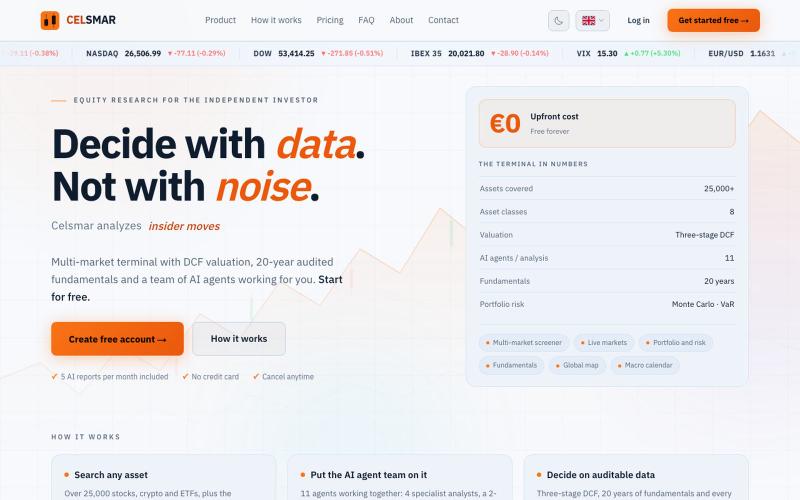
Analyse stocks, crypto, ETFs, currencies, bonds and commodities with DCF valuation, 20 years of fundamentals, a screener and portfolio risk. Start free.

@Miguel_celsmar · X
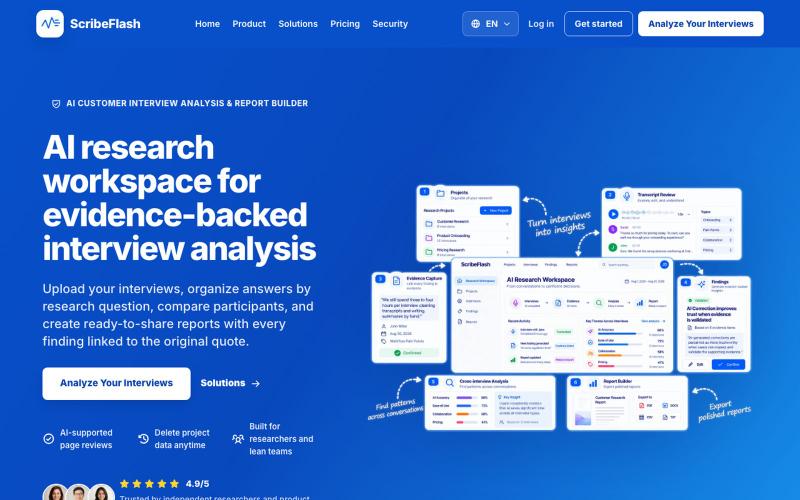
AI workspace for analyzing research interviews, generating transcripts, and extracting cross-interview insights.
ScribeFlash — 面向产品、市场与用户研究团队的 AI 研究工作台,帮助你把客户访谈快速转化为有证据支撑的洞察与专业研究报告。你可以上传访谈、查看和编辑转录内容、按研究问题整理答案、对比不同参与者、沉淀关键证据,并跨多场访谈发现主题、趋势和共识。每条 Finding 都可追溯到原始引用,让团队更快分析、更放心验证,也更容易输出可分享、可执行的研究结论
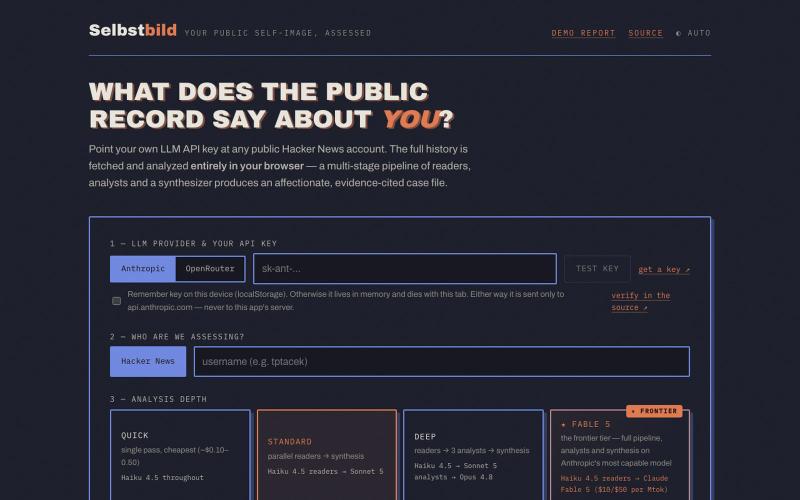
Analyze Hacker News profiles with your own LLM API key, fully client-side.
Topfi · HN
Like everyone on HN, I love nothing more than to (re)read my own comments. Getting my intuition that I am among the smartest, most humble, highest quality commenters on here confirmed by an LLM so capable that the US government had to temporarily export restrict it [0] seemed only natural. Having had my perfection confirmed, I decided to share this joy with you as I had a few percent usage left before a reset. I took a few prompts, then did a review of the output which resulted in Selbstbild, a BYOK (Anthropic / OpenRouter) web app that gives you a summary and assessment of your public comments by one of our machine Gods, including Fable 5 (provided your can afford that luxury at API pricing). In all seriousness, I have, for a long time, used my own comments on social media (including HN) as part of a personal needle-in-haystack test, simply because I do know my somewhat peculiar style and what I tend to write, but also because I can sometimes write in a slightly confusing manner, ma
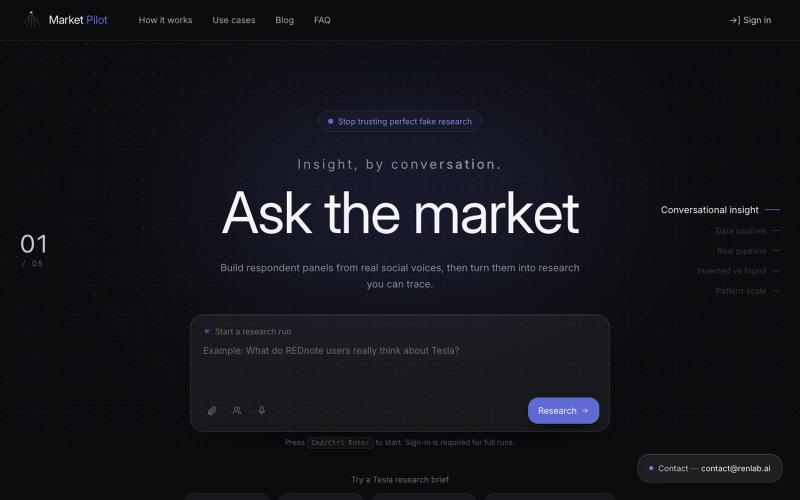
Answer market research questions using AI analysis of social media data with evidence-linked insights.
Dgeloe4-yb · GitHub
market-pilot Evidence-grounded market research prototype with traceable AI workflows.
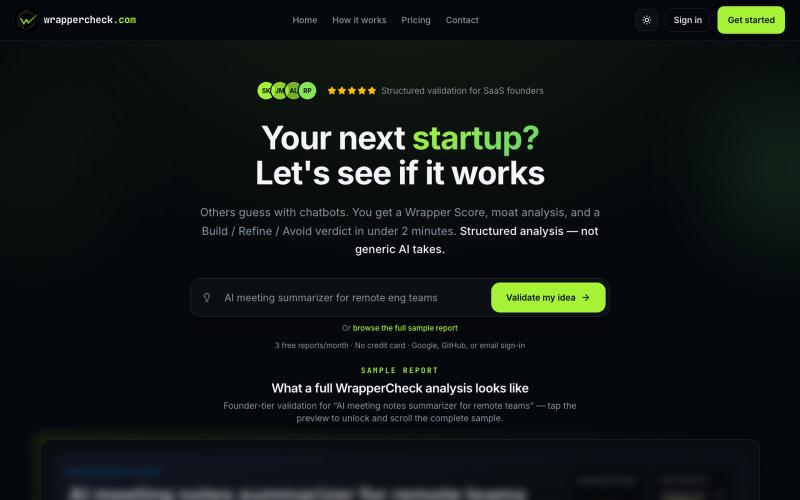
Validate your SaaS idea's defensibility with scoring, moat analysis, and competitor gaps.

@saralsachan · X
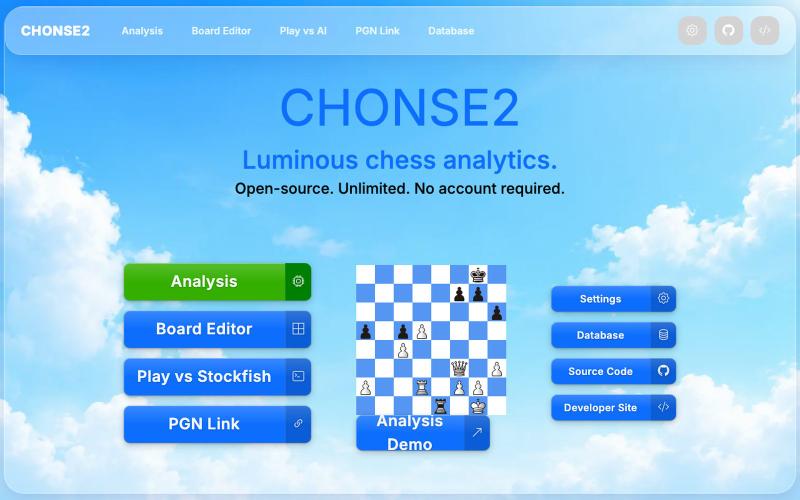
Analyze chess games with natural language explanations using an open-source browser tool with no login required.
u/ICARUS_2X · Reddit
Spent 7 months building a FOSS platform for natural-language chess analytics (No LLM) Hey guys, I've released CHONSE2, an open-source game review platform that offers unlimited analysis and move explanations without using hallucination-prone LLMs, running entirely in your browser. chonse2.com But Lichess is free, so why use this? Some have asked. It expands on Lichess's feature set a few different ways: Full analysis (accuracy/elo estimations/eval graphs, etc) requir
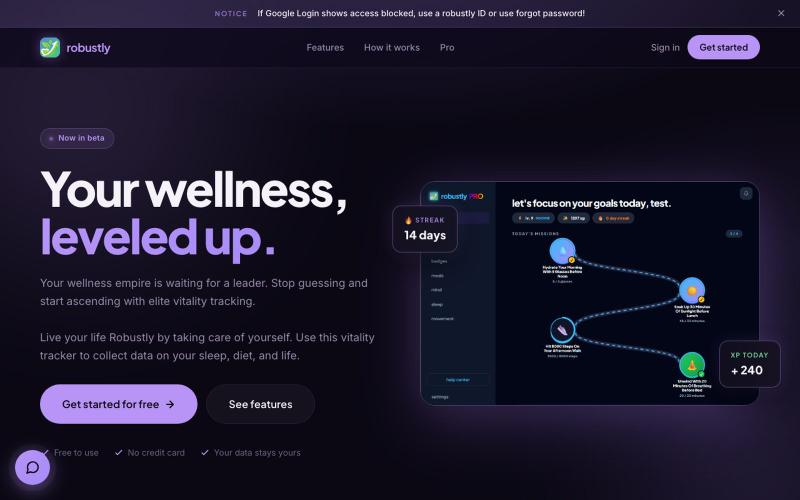
Meal-scanning wellness tracker with an AI coach that analyzes your health data.
u/snakebutlouder · Reddit
i built a wellness app that scans your meals and has an ai coach that reads your actual data been solo building this for a while. every wellness app i tried felt like a spreadsheet with steps and water in it, or a mental health app that just gave generic advice. so i made robustly, which does a few things differently: photo meal scanning. snap a pic of your plate, it logs the macros. handles multi item plates too (steak + salad + rice = 3 separate logs). posted a screenshot in the com
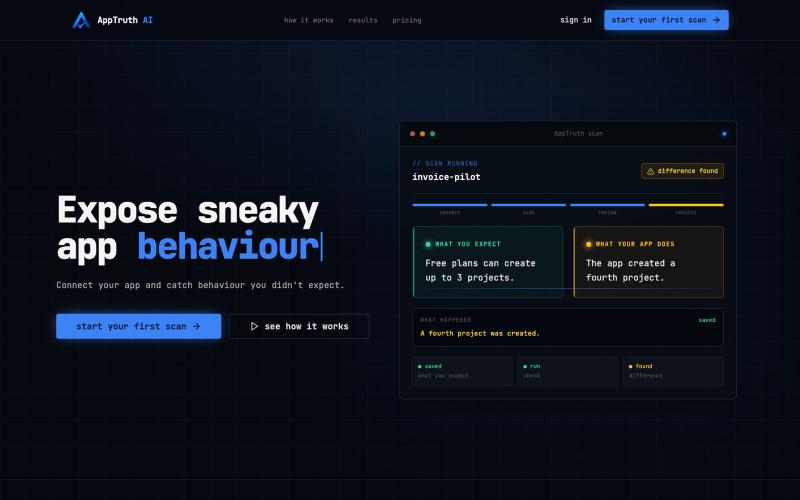
AI tool that discovers hidden bugs in your application using verification analysis.

@uriel_bitton · X
As you add more features to your vibe coded app, you increase the chances for bad behaviour. The worst part is you dont know they exist Every beta user i've had try out the app told me they found a few issues they had no idea existed Find yours using