Summagraph: Turn Text into Share-Ready Infographics
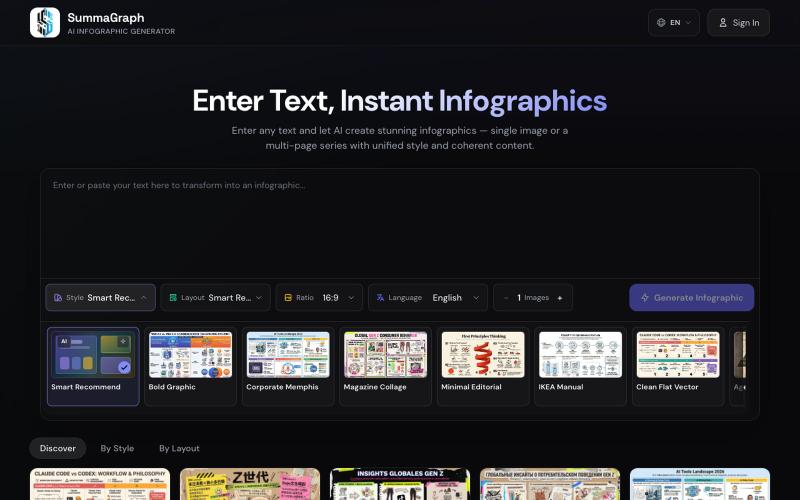
Generate infographics from text using AI with 17 visual styles and 20 layout templates.
SummaGraph — AI 信息图生成工具,粘贴任意形式的文本即可一键生成高质量信息图,内置 20 种视觉风格 × 20 种布局模板,支持系列模式一次生成多页风格连续的信息图,覆盖中英日韩等 9 种语言
The full gallery
Tech stack
60 projects

Generate infographics from text using AI with 17 visual styles and 20 layout templates.
SummaGraph — AI 信息图生成工具,粘贴任意形式的文本即可一键生成高质量信息图,内置 20 种视觉风格 × 20 种布局模板,支持系列模式一次生成多页风格连续的信息图,覆盖中英日韩等 9 种语言

FortCRM by FortSoftware manages 5 data types including clients. Helps you organize, track, and share your work in 1 place for teams and solo users.
@JonathanBrahmi · X

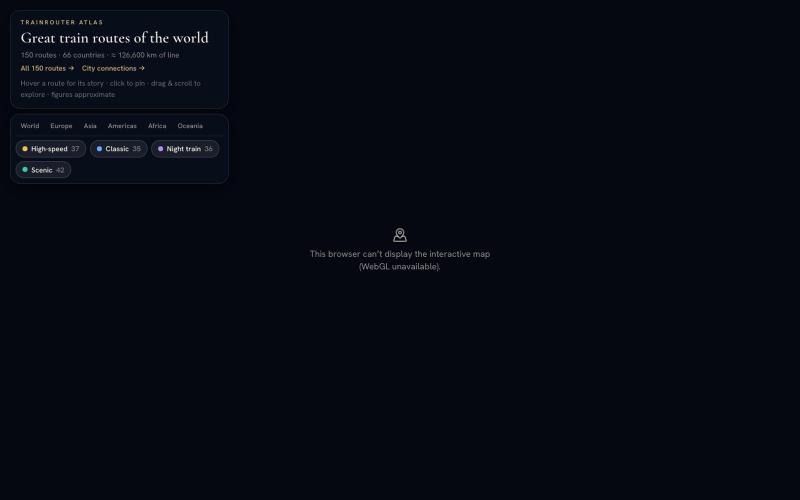
Explore 150 train routes on an interactive map with facts about each line.
@Flightmussy · X

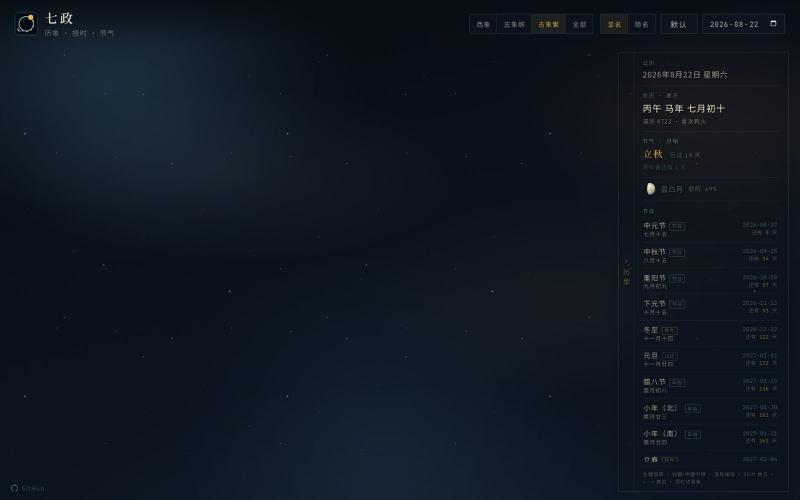
Interactive visualization of the 24 Chinese solar terms and real-time celestial positions.
bunai · V2EX
直观可视二十四节气以及星象位置 🔗 **在线体验**:[https://dipper.bunai.cc/]( https://dipper.bunai.cc/) ## 🖱️ 操作指南 - **换日**: ← → - **其他**: 自己摸索吧 ## 💡 灵感来源 灵感来源于 [@est 老哥]( https://www.v2ex.com/t/1235992) 想了一下如何直观的看二十四节气以及星象位置 欢迎大家尝尝咸淡,比较烧显卡~

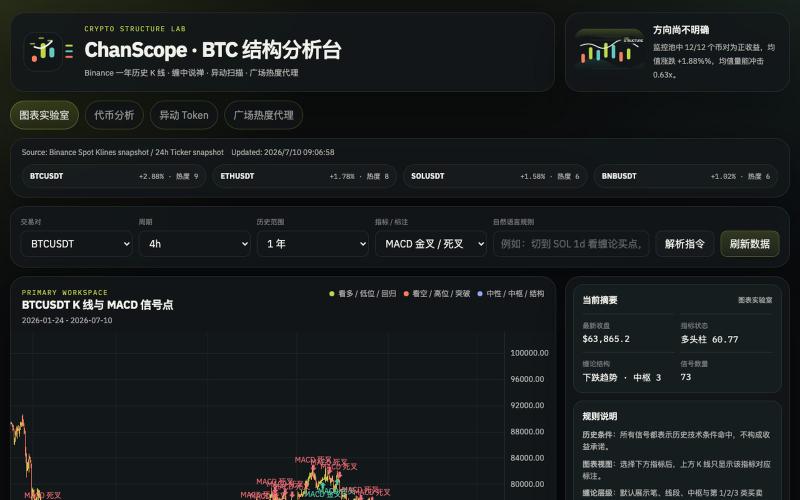
Analyze cryptocurrency markets with Chan Theory patterns, K-line charts, and anomaly detection.
@onehopeA9 · X
用 DAPPOS @dappOS_com 做了一个加密货币缠论分析网站,也是我一直想做没时间做的! 来看看缠论三买的威力: 不是不会写代码。 我自己是程序员,真要硬写当然能写。 但问题是:没时间。🤡 做交易的人都懂,真正消耗人的不是“看一根 K 线”,而是把一堆信息拼起来: K 线结构。 缠论笔、中枢。 一买二买三买。 一卖二卖三卖。 资金费率。 持仓量变化。 成交量异动。 市场舆情。 这些模块涉及太多方面,写得出来,但太费时间。 所以我一直想做一个自己的交易雷达: 接币安历史数据。 用 TradingView 展示 K 线。 自动画缠论结构。 标注买卖点。 再把资金费率、持仓量、成交量和币安广场热度放进去。 想法很清楚。 但一直躺在 TODO 里。 最近用 xbubble 的 Coding 功能试了一下,直接把需求丢进去: “做一个加密货币缠论分析网站,接入币安一年历史数据,用 TradingView 展示 K 线,自动画笔、中枢、一买二买三买、一卖二卖三卖,增加异动分析和币安广场舆情热度。” 它真给我生成了一个能跑的原型。 这次最戳我的不是“AI 会写代码”。 而是 xBubble 把最消耗时间的工程杂活压短了。 以前我自己做: ❌ 搭项目结构 ❌ 爬数据源和图表库 ❌ 写 K 线处理 ❌ 写缠论结构识别 ❌ 做前端交互 ❌ 部署、改样式、修细节 一圈下来,核心想法还没验证,人先累了。 现在变成: ✅ 先描述业务目标 ✅ 让 xBubble 生成可运行原型 ✅ 我再校验规则、调整逻辑、优化体验 ✅ 把时间花在交易理解和产品迭代上 这对程序员其实很有价值。 因为程序员最缺的不是能力,而是时间和注意力。 我这个原型现在大概有几块: 第一,TradingView K 线主图。 用币安数据展示行情,再叠加缠论结构。 第二,笔和中枢。 把原本需要手动盯的结构,先自动画出来。 第三,买卖点雷达。 一买、二买、三买,一卖、二卖、三卖,先帮我筛可能的位置。 第四,异动面板。 资金费率、持仓量、成交量变化,和 K 线结构一起看。 第五,舆情热度。 把币安广场讨论热度也拉进来,看看市场情绪是不是和盘面互相印证。 你可以理解成: 我不是让 AI 替我交易。 我是让 AI 帮我做一个交易前的信息雷达。 我觉得 xBubble 和普通 AI

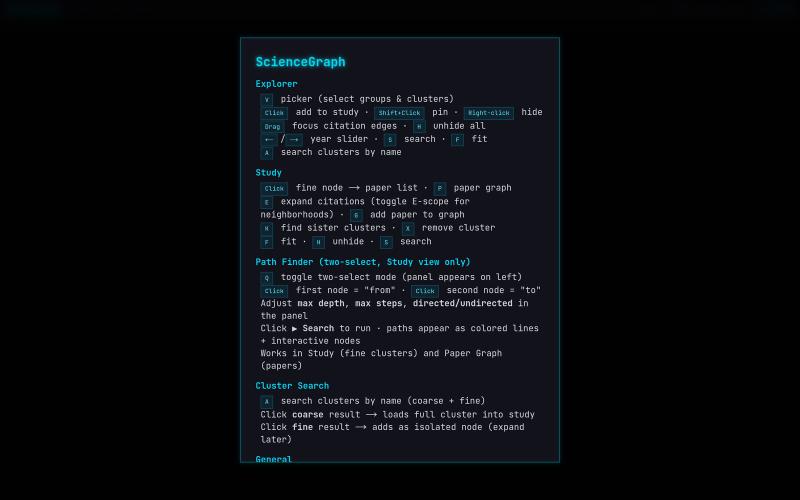
Interactive WebGL visualization of scientific citation networks and papers.
@lushptr · X
I feel really guilty for vibe coding this but it looks cool even tho it is really inefficient and broken you can use it too now I'll desloppify it after exams I swear

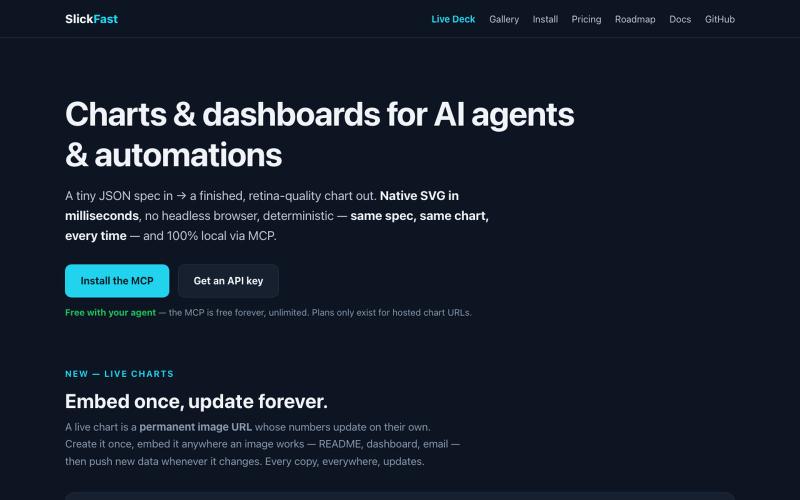
Convert JSON specifications into charts and dashboards; includes free MCP server for AI agents.
@SlickFastHQ · X

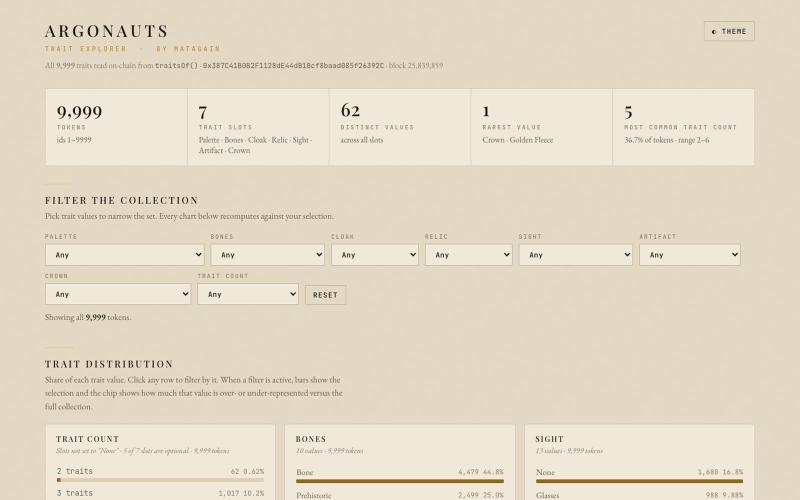
Interactive explorer for browsing Argonauts NFT collection traits.
@N3R01N · X
i vibe coded a collection/trait explorer for the argonauts because why th not. borrowed your website style, i hope that is ok. you can find it here: everything opensource on gh if you are interested :)
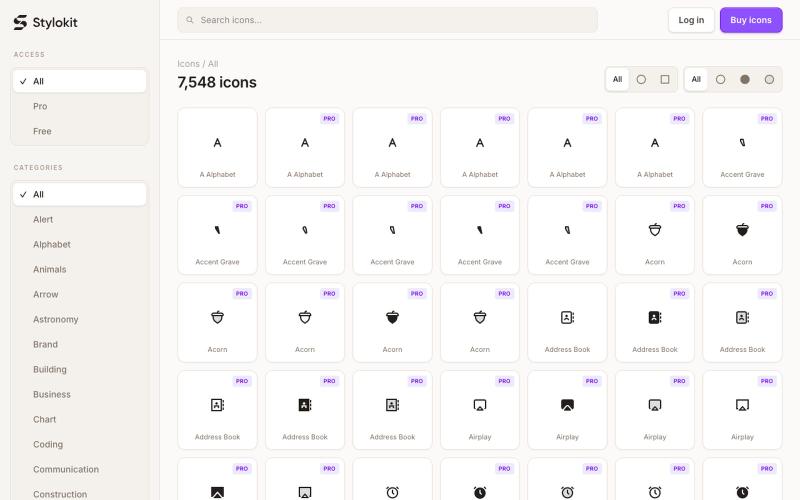
Browse 7,584+ consistent SVG icons for React, Figma, and Framer. Search Round and Sharp icon styles, then copy clean SVG, TSX, or React components for your next product.
@Dmytri_Design · X

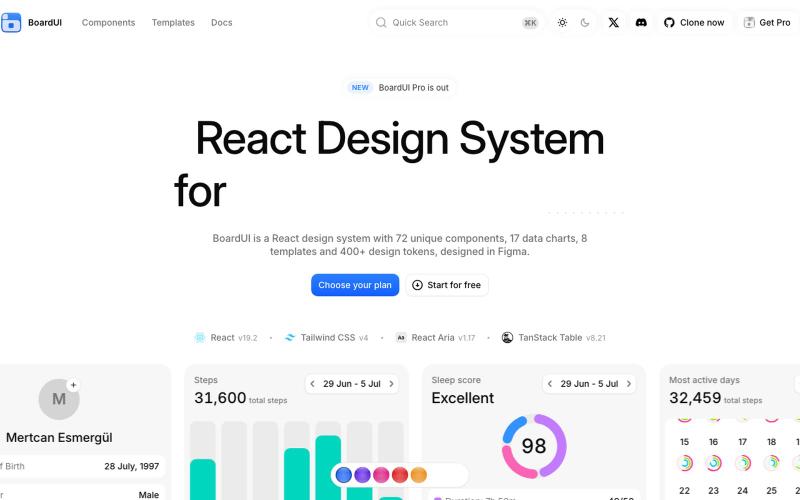
Build AI dashboards and agent interfaces with 72 React components and chart cards.
BoardUI · GitHub
boardui React design system for agentic interfaces. Every free BoardUI component as source, with a working AI chat app on your own model key as the homepage.

Interactive trainer for reading musical notation and tapping along to rhythms.
nullzzz · HN
Music Rhythm Reading Trainer

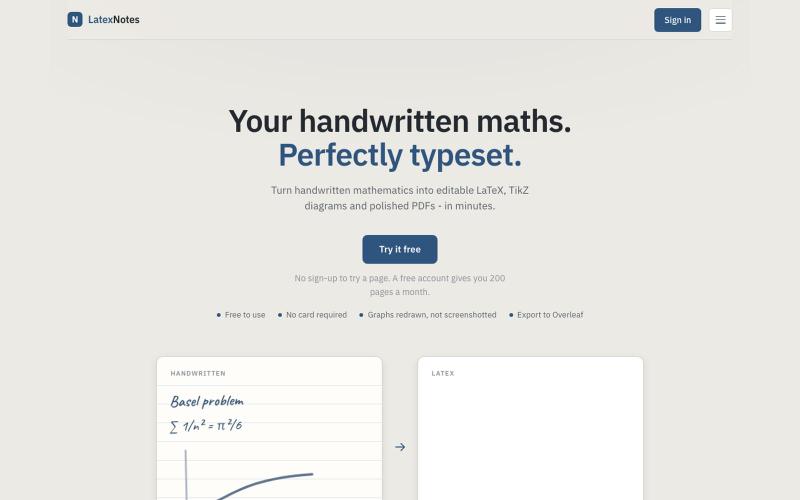
Convert handwritten math notes to editable LaTeX and PDFs.
u/Worth_Difference_282 · Reddit
Handwritten notes into latex + study tools - looking for feedback Hey everyone, I'm a mathematics student at university, and over the past few months I've been building something called LatexNotes in my free time. The original problem was pretty simple, I like taking paper handwritten maths notes, but whenever I wanted to turn them into proper LaTeX afterwards or to get AI to mark answers, it was a pain. I kept needing to switch between my university’s content platform, then to Chatgpt to e