

Productivity5 days ago
FieldCam — Jobsite Photo Documentation & Field Reports
Organize jobsite photos and videos by project with GPS, timestamps, and auto-generate PDF reports.

@12squaredAI · X
| @fieldcam_app
The full gallery
Tech stack
60 projects
Organize jobsite photos and videos by project with GPS, timestamps, and auto-generate PDF reports.
@12squaredAI · X
| @fieldcam_app
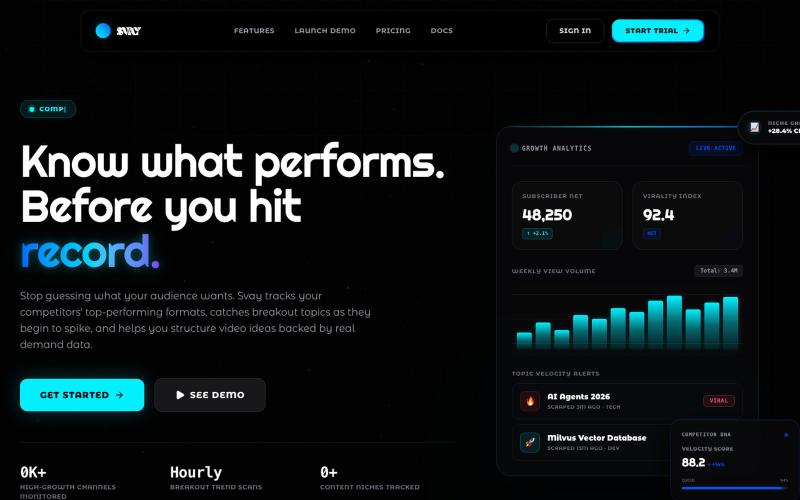
Advanced Content Ecosystem Tracking and Creator Analytics Platform

@BuiltByAmar · X

Scan receipts to automatically track warranties, file claims, and monitor coverage.

@Keevora_ · X
Likewise. Hi, just shipped this week. Finally reached the stage where Keevora works end-to-end. ✅Scan receipt 📷 Store warranty 📷 Track brand replies & auto revert Live:
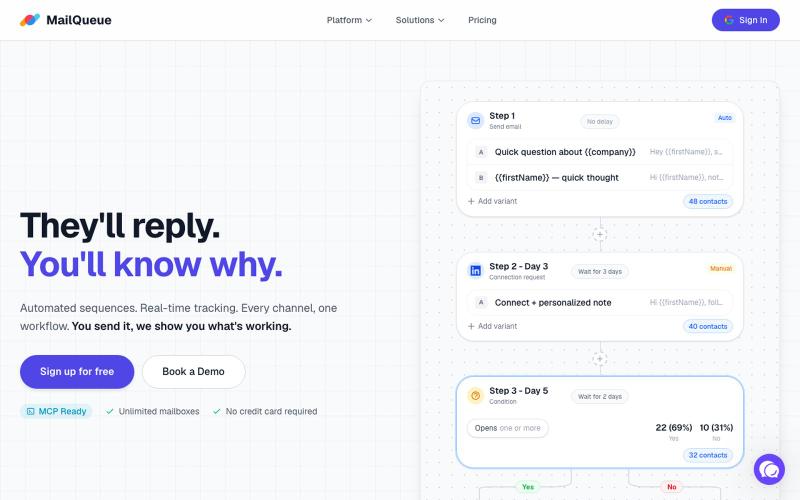
Automate cold outreach campaigns across multiple channels with real-time tracking.

@NikolozMuladze · X

Guess the time and location of AI-generated images in this geography game.
TimeGuessr — 给你一张图片,让你猜测图片发生的时间和地点。我们把 Timeguessr 的玩法原封不动地搬了过来,只是把图库换成了另一批“假照片”——全部由 AI 生成的过去 50 年里可能发生的瞬间
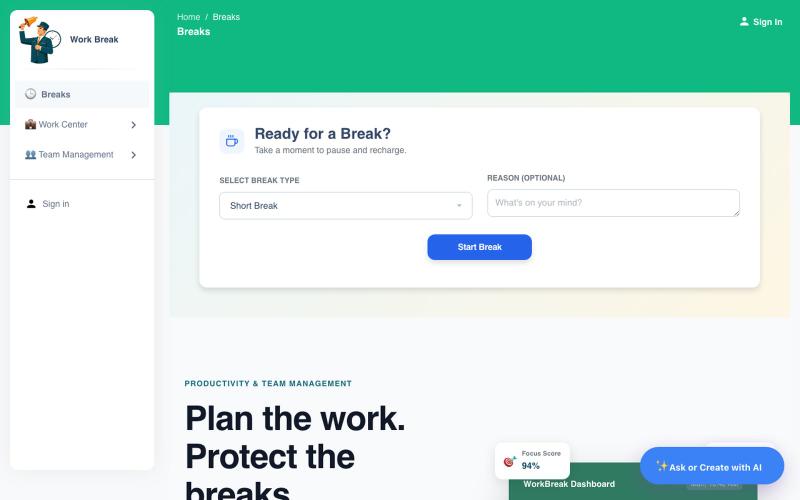
AI-powered assistant for logging breaks, managing tasks, and tracking productivity with calendar sync.

@WorksBreaks · X
Building Work Break; an AI-powered break and productivity assistant for teams. It helps you manage breaks, tasks, leave, meetings, and stays fully synced with Google Calendar all in one place. Would love your feedback! 👉
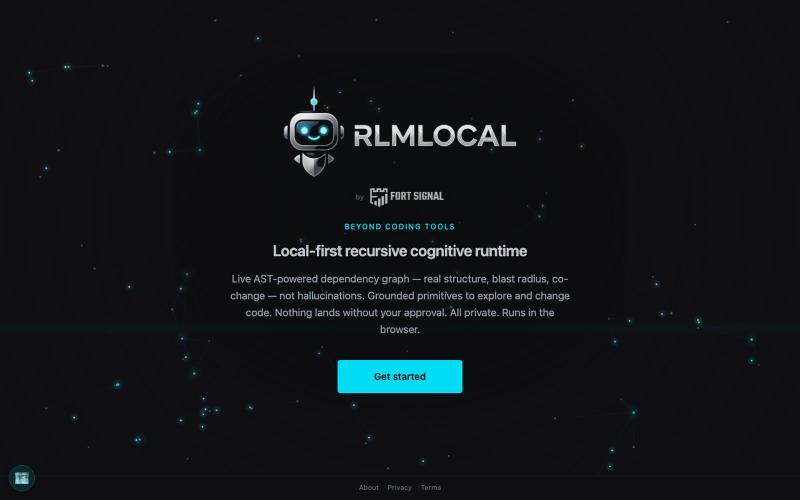
Local-first cognitive runtime with live AST graphs, runs in your browser with no data sharing.

@fortsignal1 · X
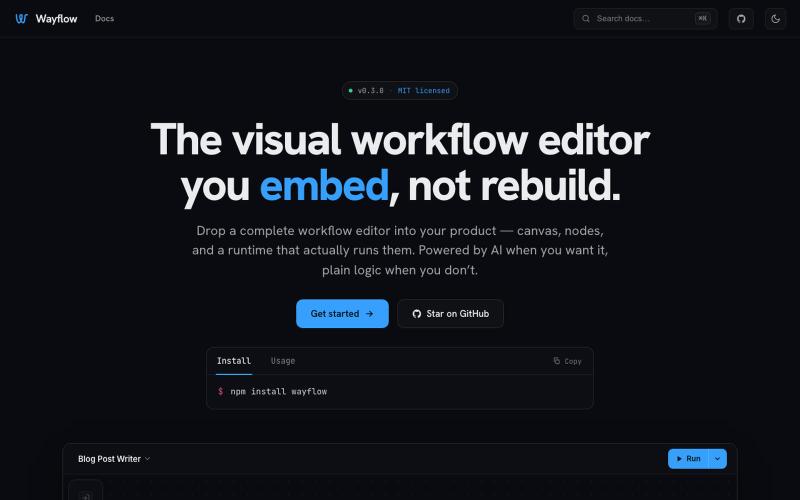
Embeddable visual workflow builder for web apps with optional AI assistance.
tahazsh · HN
Hi! I’m Taha. In many agentic products that support workflows (including one I worked on), I noticed they either don’t support node-based editors, or use React Flow and go through the difficult work of integrating it into their product to run it and work with their existing logic. So I thought about creating a tool that could help with this by closing the gap between the editor and the runtime. That’s why I created Wayflow. The basic architecture is simple: you just need to create a graph (which is a JSON object) that the runtime knows how to run. The runtime doesn’t care where that graph is coming from, it just needs the right schema. And with the help of the editor, you can create the graph, and then export it or directly save it on your backend in your database. And then when you want to execute it, you just hand it to the runtime. The runtime can either stream the execution (which is useful for the editor), or give you the final result. How you execute the graph is up to you: t
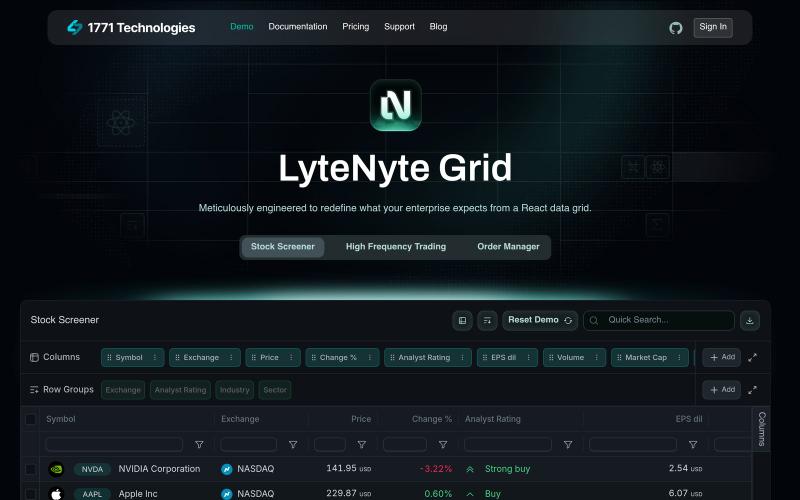
Try a high-performance React data grid component optimized for enterprise use.

@leethatengineer · X
Building LyteNyte Grid
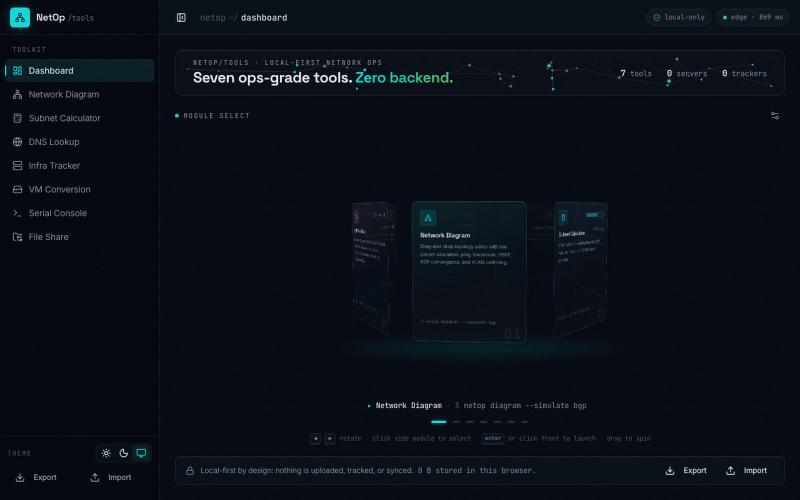
@UK_Daniel_Card I made something similar https://t.co/HCVGlFb8hF. Its completely vibe coded but it is supposed to be a vibe project. Been making it for about 6 months now. Feel fre

@slacksarenice · X
I made something similar Its completely vibe coded but it is supposed to be a vibe project. Been making it for about 6 months now. Feel free to take inspiration from it 😅

Audit and optimize your local business visibility across ChatGPT, Perplexity, and Claude.

@Timemindai · X
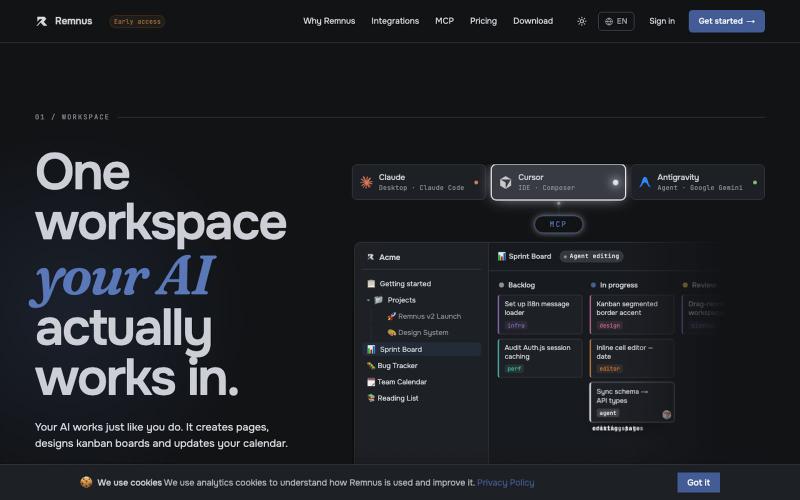
Build databases, kanban boards, and notes for AI agents to collaborate on.

@emir_ogz · X
Just shipped - AI-native workspace for solo devs Agent reads/writes your project notes automaticly