

Education1 month ago
数学小课堂 - AI 帮你理解数学题
Input a math problem to get AI-generated visual explanations for learning.

@laodaozzz · X
我也做了一个教小朋友学数学的工具叫easymath。
The full gallery
Tech stack
60 projects
Input a math problem to get AI-generated visual explanations for learning.
@laodaozzz · X
我也做了一个教小朋友学数学的工具叫easymath。
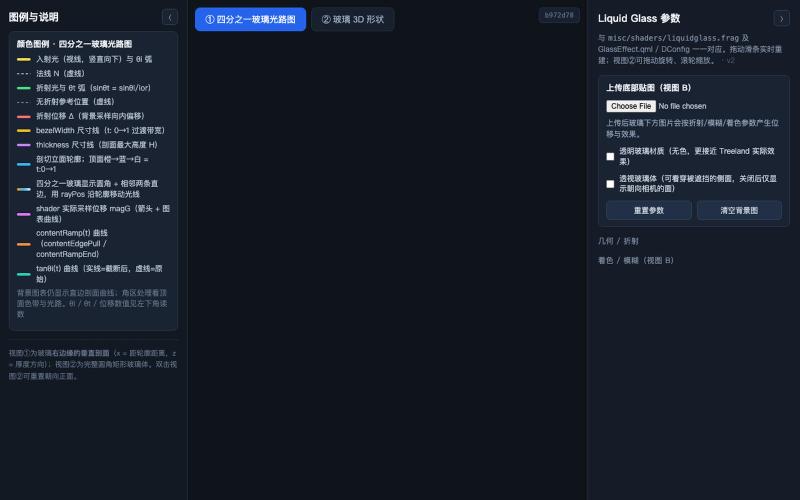
Interactive 3D visualization of glass effects, showing how radius, thickness, and bezel width affect refraction.

@zccrs · X
做了一个 Liquid Glass 3D 可视化工具 🫧 把玻璃边缘的图像形变从 2D 变成直观的 3D 几何,让你可以直接看到玻璃的形状、光线与折射,以及 radius、thickness、bezel width 等参数对最终效果的影响。 欢迎体验: 🔗
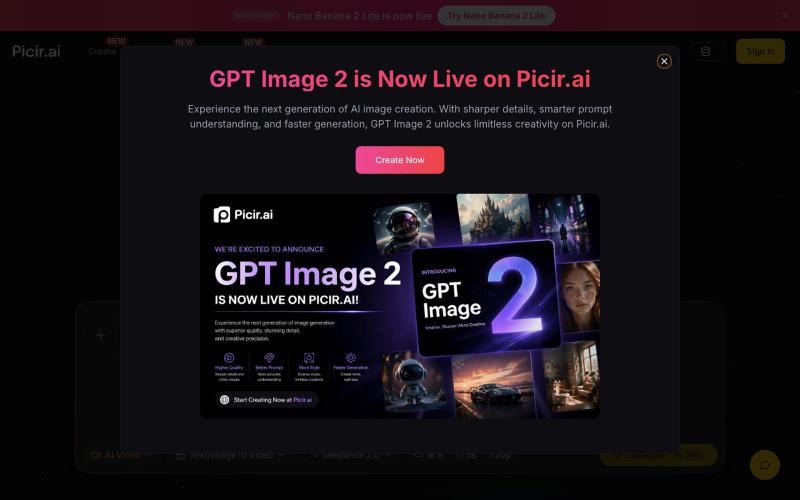
Generate and edit videos and images using advanced AI models.
Nano Banana AI 图像编辑器 — 基于最先进的 AI 图像编辑模型 Nano Banana 开发的图片编辑器,用嘴改图、保持角色一致性、控制细节、图片融合
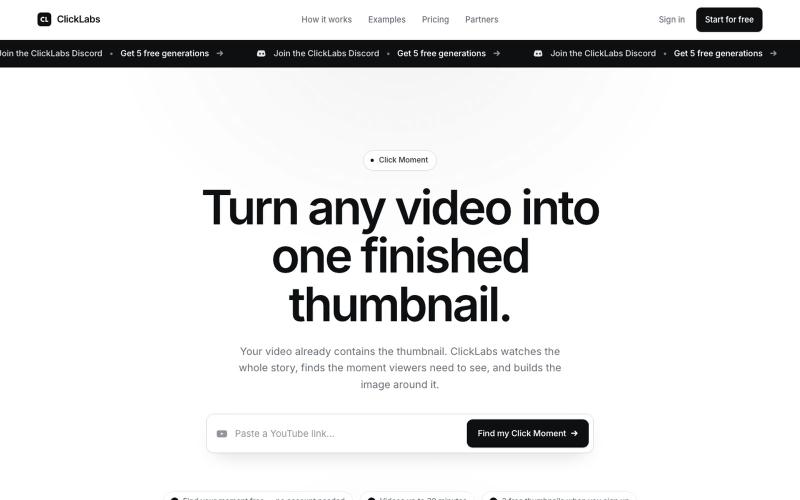
AI analyzes your video to find the strongest visual moment and generates a YouTube thumbnail.

@useclicklab · X
an AI tool that watches your video, finds its strongest moment, and turns it into a clickable YouTube thumbnail.

Convert code into interactive flowcharts for learning, debugging, and documentation.

@Sparsh209 · X
Hi isha! Check it out here at: Would love to hear your feedbacks
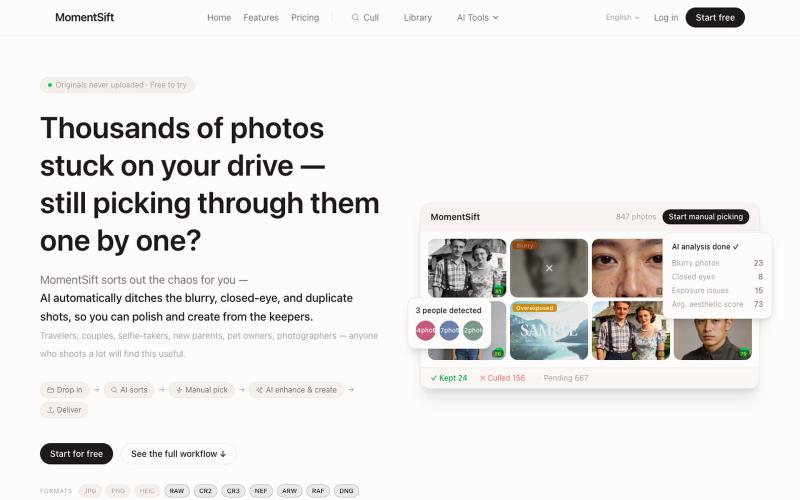
Cull, enhance, and generate photos with AI in your browser.
ansheng_hu · Product Hunt
MomentSift Cull, enhance, and create better photos with AI
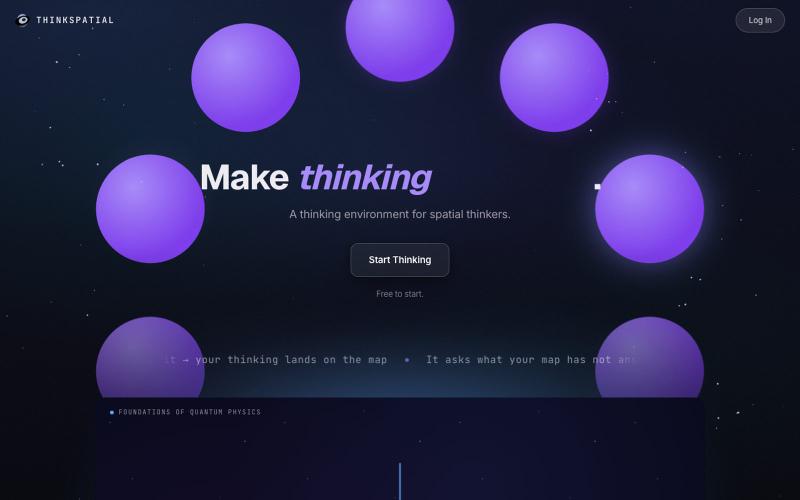
Organize thoughts into visual maps that extract key insights and transform them into documents and presentations.
u/shadowosa1 · Reddit
I rebuilt my landing page after 300+ visitors still didn’t understand what my app does. I’ve been building a spatial thinking environment called ThinkSpatial, and one of the hardest parts hasn’t been building the product. It’s been explaining what it is in the first few seconds. The basic idea is simple. You speak or type, and your thinking gets turned into a visual map instead of disappearing into a chat box, doc, or note-taking app. My first landing page was way too focused on showing h

A visualization language designed for AI agents to create and interact with charts.
chenglong-hn · HN
Data visualizations are the bridge between user and data. But building AI agents that can generate visualizations reliably can be very tricky: - simple chart specs can be reliable, but generated charts are often of low quality due to reliance on system defaults; - complex chart specs with explicit details can produce good-looking charts, but they are verbose and agents can struggle with reliability We figured out it is a limitation on the language issue (not just AI capability thing) -- current visualization languages are a bit too low-level for AI agents, requiring them to explicitly make visual decisions that are supposed to be handled by a good compiler. Flint is a visualization intermediate language to address this issue, allow AI agents to solve this last-mile human-agent interaction problem. It provides a simple semantic-type based specification, and contains a layout optimization engine that can produce good-looking charts (filled with derived low-level details) from simple
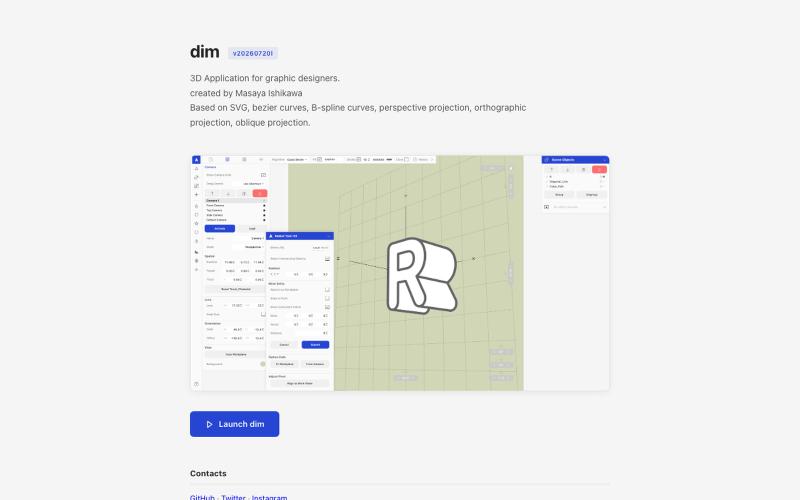
Import 2D paths from Adobe Illustrator, transform them in 3D, and export as vectors without rasterizing.

@kamone · X
I built (vibe coded) my own geometry engine from scratch. It keeps path as path, and does the transformation and the silhouette splitting. You can see the code here. One single html file.
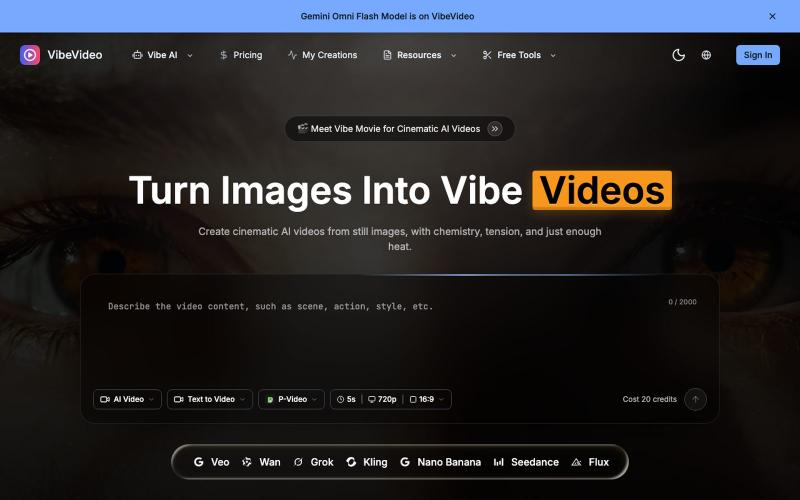
Generate cinematic videos from images and text with AI-controlled motion effects.
Vibe Video — 面向普通用户的 AI 视频生成网站,支持文生视频、图生视频、参考图生视频和电影化镜头控制,适合创作者和营销团队快速产出视频
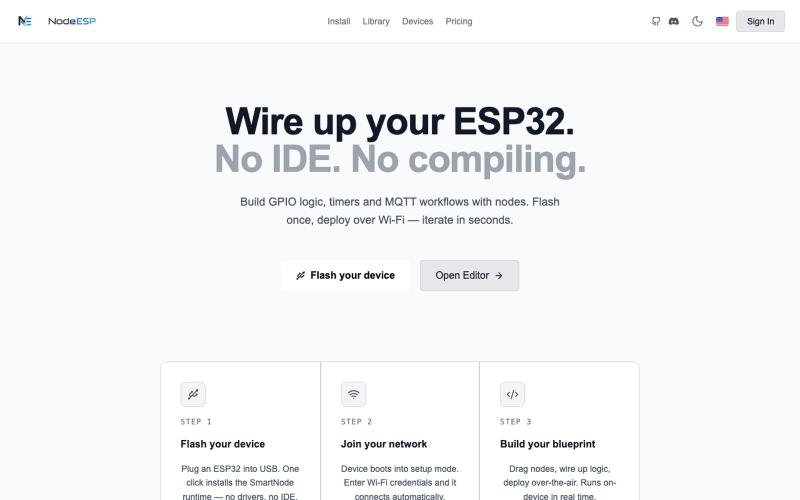
Visual node-based programming environment for creating GPIO logic and MQTT workflows on ESP32 devices.

@NodeESP · X
- Project for sale
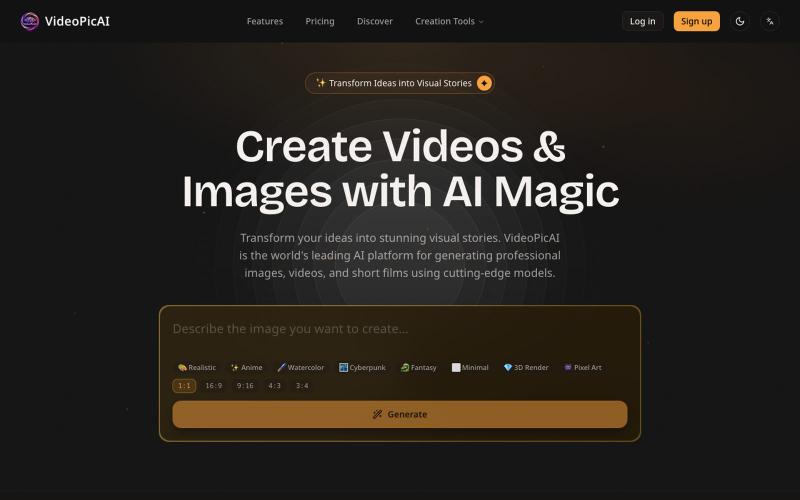
Generate images and videos by describing your ideas using AI.
struy · HN
Transform your ideas into stunning visual stories. VideoPicAI is the world's leading AI platform for generating professional images, videos, and short films using cutting-edge models.