
Health & Wellness3 days ago
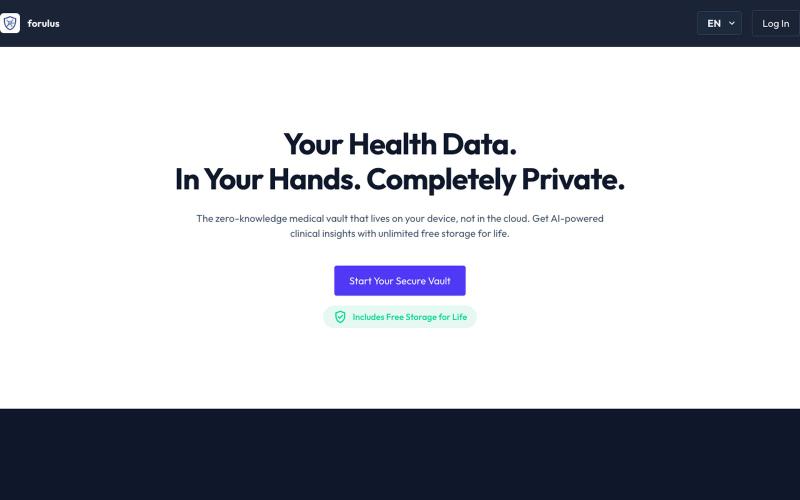
forulus | Local-First Medical Data Vault
Log and manage your medical history locally, with optional premium AI insights and export.

@ernesto_lana · X
The full gallery
Tech stack
60 projects
Log and manage your medical history locally, with optional premium AI insights and export.
@ernesto_lana · X
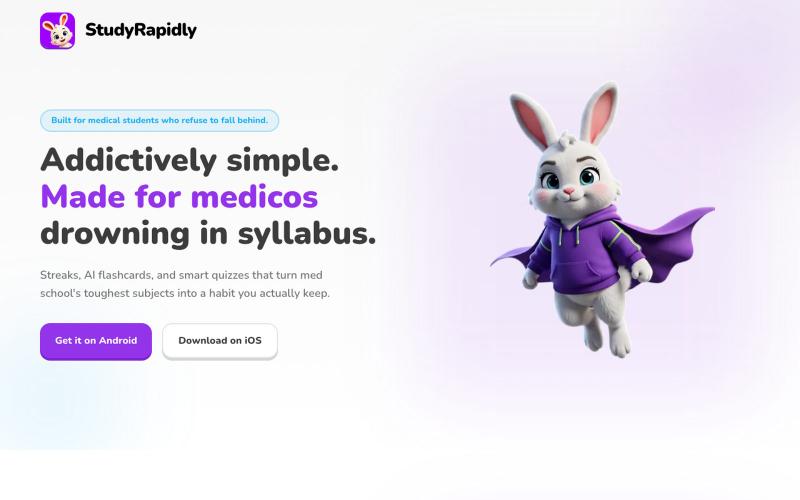
Converts study PDFs into flashcards, quizzes, and audio podcasts with weak-area detection.

@indiesaasgrowth · X
I built a study app. . It's a study app for medicos , it turns pdf into flash cards , audio podcasts, quizzes and so on. It makes study easier. And also reminds them to study and analyses their weak points and then it trains us accordingly. It also shows their performance and progress over time .
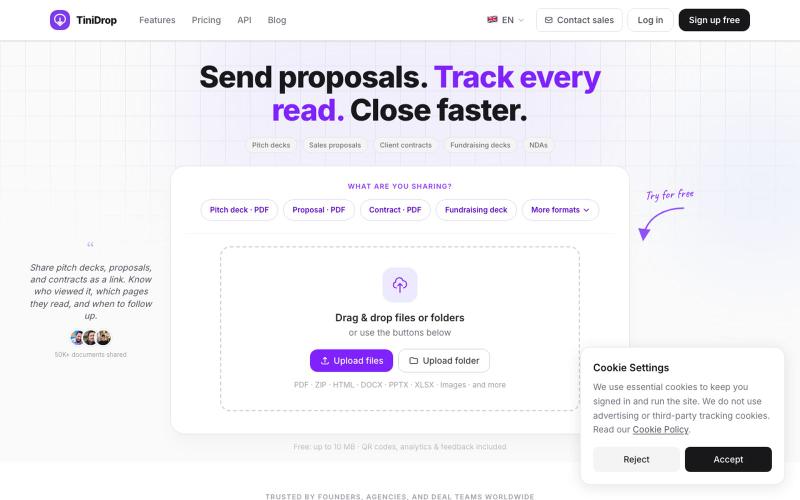
Share PDFs and documents as secure links while tracking who viewed each page.

@adhikari_premi · X
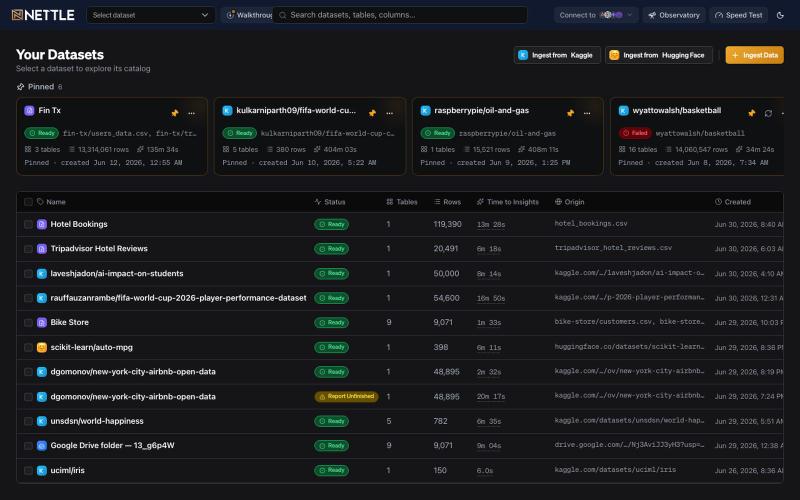
Ingest, explore, and analyze datasets with autonomous data processing in an interactive workspace.

@kashyap_ai · X
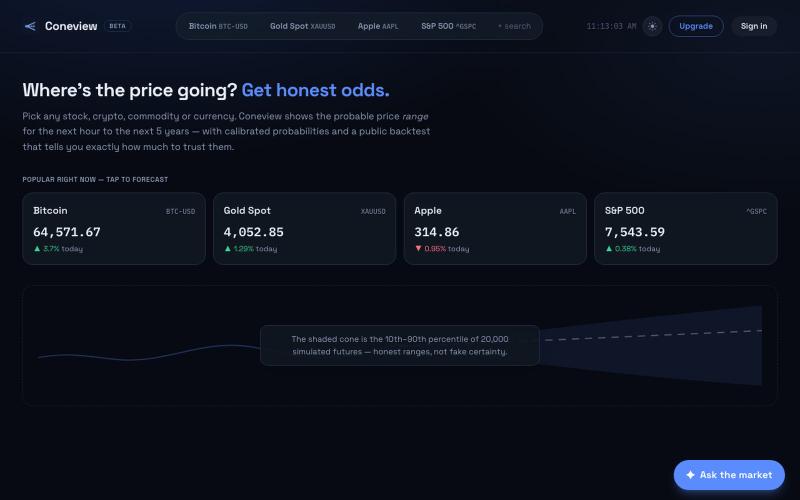
AI-powered price forecasts for stocks, crypto, and commodities with calibrated probabilities and backtested accuracy.

@iqbal_saqi2522 · X
- An AI-based Prediction System
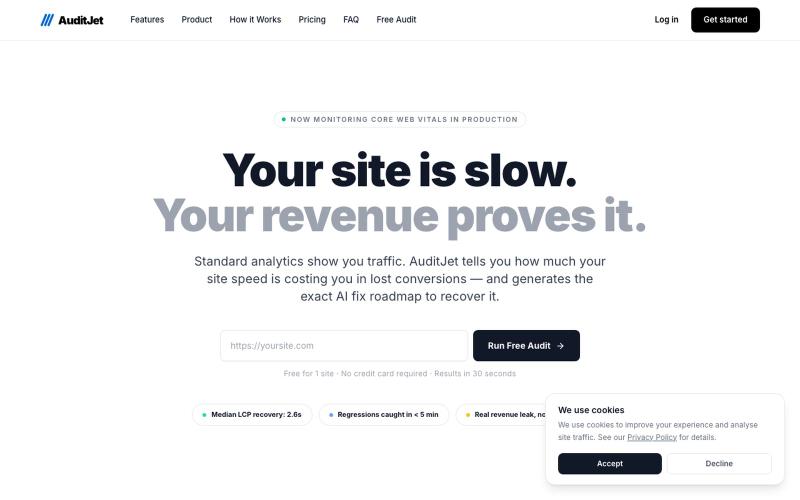
Monitor Core Web Vitals and measure how slowdowns impact your revenue.

@AuditJet · X

A visualization language designed for AI agents to create and interact with charts.
chenglong-hn · HN
Data visualizations are the bridge between user and data. But building AI agents that can generate visualizations reliably can be very tricky: - simple chart specs can be reliable, but generated charts are often of low quality due to reliance on system defaults; - complex chart specs with explicit details can produce good-looking charts, but they are verbose and agents can struggle with reliability We figured out it is a limitation on the language issue (not just AI capability thing) -- current visualization languages are a bit too low-level for AI agents, requiring them to explicitly make visual decisions that are supposed to be handled by a good compiler. Flint is a visualization intermediate language to address this issue, allow AI agents to solve this last-mile human-agent interaction problem. It provides a simple semantic-type based specification, and contains a layout optimization engine that can produce good-looking charts (filled with derived low-level details) from simple
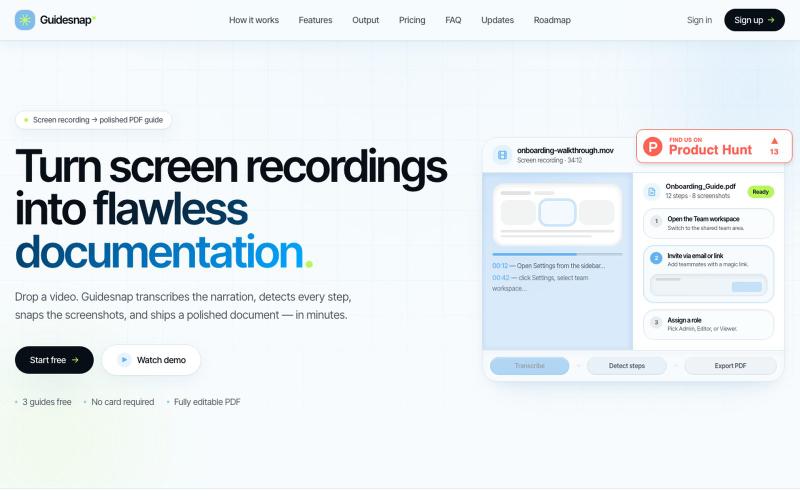
Convert screen recordings into formatted PDF guides automatically.

@vanmurten_eth · X
Guidesnap: turn any screen recording into a polished PDF guide.
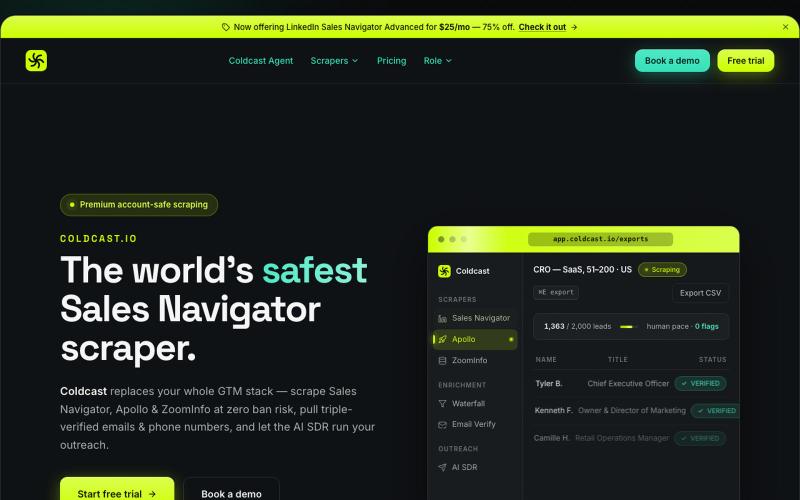
Export LinkedIn Sales Navigator leads from your browser, up to 20,000 daily.

@hasanrahma00 · X
Hey Founders, try for cold outbound geneate paid users.
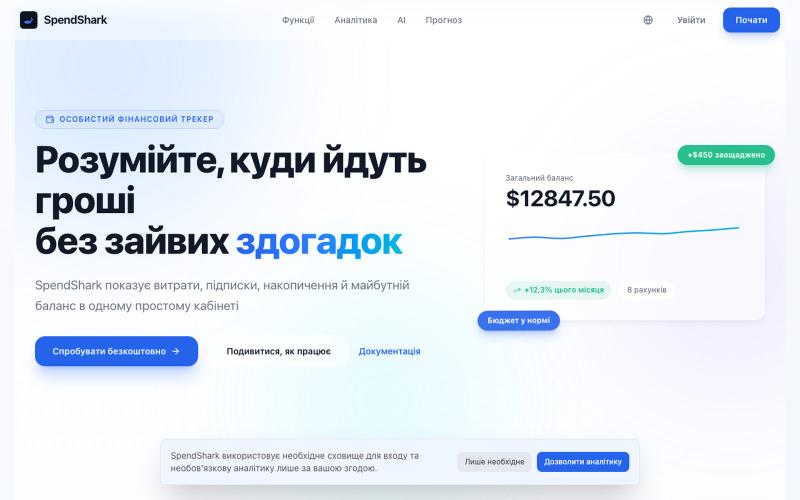
Track personal expenses, budgets, subscriptions and financial goals in one dashboard.

@Bogdan266624 · X
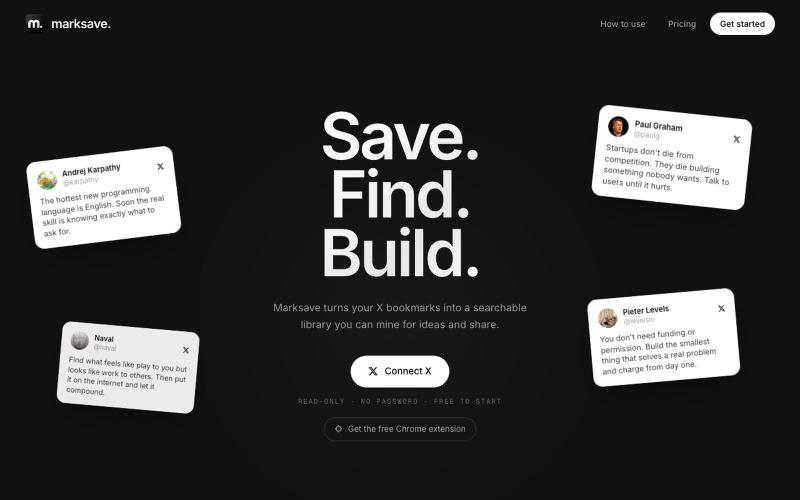
Import your X bookmarks and access them in a fast, organized, searchable library.

@xoshiLads · X
I'm launching my first SaaS today: I'm usually the type to have a million creative ideas daily, start something, get another idea, and abandon that ship. I joined @shipordie_ recently because I genuinely think it's a cool concept: launch a product monthly or get kicked from the group. For procrastinators that seems like a good solution. Happy to be on board. I built marksave because my bookmarks were a graveyard. I kept saving more every day and never used any of it. Thousands of things I saved and never found again. While saving more and more each day. So: a free Chrome extension pulls your X bookmarks in (read-only, it never sees your password), AI auto-categorizes them (paid feature), and you get a library you can actually search. Search by meaning instead of keywords, ask questions about your own saves, and it resurfaces the stuff worth a second look. You can also group saves into folders and share them with a public link. One thing that's already in there:
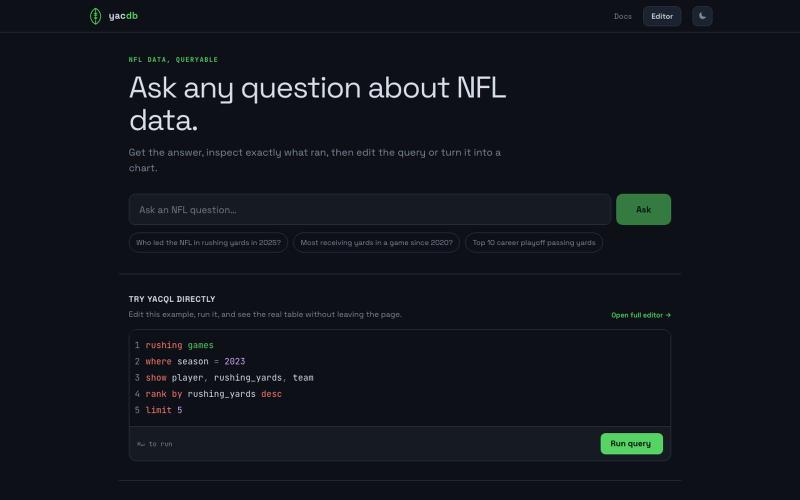
Query NFL statistics using natural language or YACQL, instantly create shareable tables and charts.
u/Fun-Calendar8486 · Reddit
I am building yacdb.fyi, letting users ask natural-language questions about NFL data and turning them into queryable results. Yacdb.fyi goal is to allow users to construct questions about NFL data, think "Best 1st down conversion rate in 2025", and exposing a custom query layer on top (think SQL) allowing users to define their own queries to build data sets. They can chart in the app, using built in tooling, but can export the data as well if they want to use their own tooling. I am look