SWE180 - Best Preparation and Learning Platform
Learn data structures and algorithms through interactive visualizations and interview prep tools.
@aarsh_30 · X
The full gallery
Tech stack
60 projects

Learn data structures and algorithms through interactive visualizations and interview prep tools.
@aarsh_30 · X

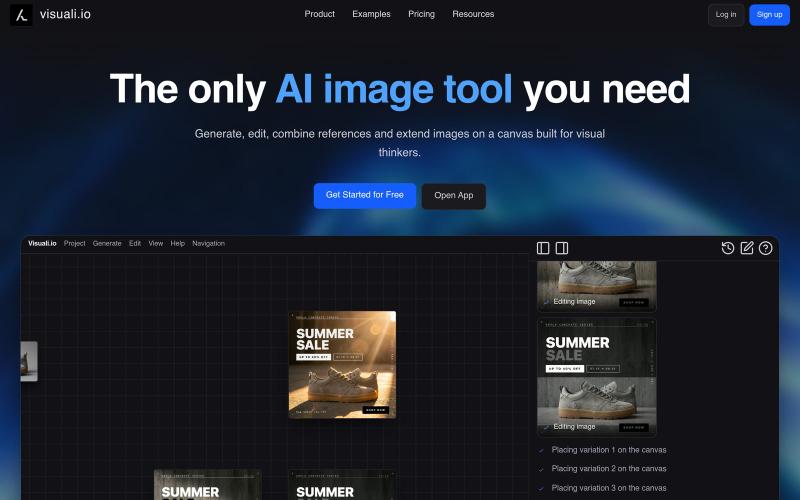
Open-source design tool for creating graphics in the browser.
@akinkunmi · X
He trash-talked me and my amazing project ( unprovoked while all his projects are vibe-coded slop. That's why I named him King of Slop.

Organize and share work across 5 data types in one collaborative workspace for teams and solo users.
@RunXItApp · X

Create beautiful crystal visualizations and patterns.
@songfeitong · X
Introducing Pretty Lattice, a modern-looking crystal visualization tool for creating beautiful figures. Built with Codex since 5.5, and now with 5.6 sol. A huge leap from 5.5, much better at frond end. Github: Demo:

Track user events and analyze product behavior with an analytics dashboard.
@kitbasedev · X
We just launched, check us out at

Debug and monitor AI agents with real-time visualization and performance analytics.
@simranrambles

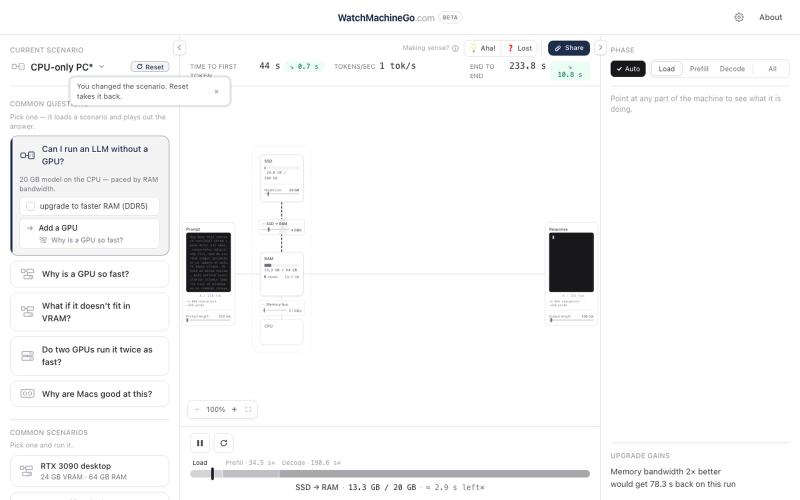
Explore a browser-based databox cluster simulator featuring raft consensus, key/value sharding, and blob storage.
SamInTheShell · HN
My Fable 5 Project Was a Multiraft Database and Blob Store

Embeddable visual workflow builder for web apps with optional AI assistance.
tahazsh · HN
Hi! I’m Taha. In many agentic products that support workflows (including one I worked on), I noticed they either don’t support node-based editors, or use React Flow and go through the difficult work of integrating it into their product to run it and work with their existing logic. So I thought about creating a tool that could help with this by closing the gap between the editor and the runtime. That’s why I created Wayflow. The basic architecture is simple: you just need to create a graph (which is a JSON object) that the runtime knows how to run. The runtime doesn’t care where that graph is coming from, it just needs the right schema. And with the help of the editor, you can create the graph, and then export it or directly save it on your backend in your database. And then when you want to execute it, you just hand it to the runtime. The runtime can either stream the execution (which is useful for the editor), or give you the final result. How you execute the graph is up to you: t

Monitor and investigate failures across multi-agent systems from a live dashboard.
leylal0016 · HN
AgentPulse detects and investigates failures in multi-agent systems

Inspect RAG chunks and visualize AI agent workflows, memory architecture, and execution traces.
@Higgs0110 · X

Explore interactive visualizations of mathematical curves, fractals, symmetry, and topology.
@vkuoo · X
Added more demos showcasing graph-math relationships, built with Codex.

Create diagrams from text using Mermaid, PlantUML, and D2, then export as PNG/SVG.
@soyalexdzul · X
Open-source platform for creating, organizing, and exporting diagrams using plain text markup. It combines the power of Mermaid, PlantUML, and D2 with a polished interface