
Education3 days ago
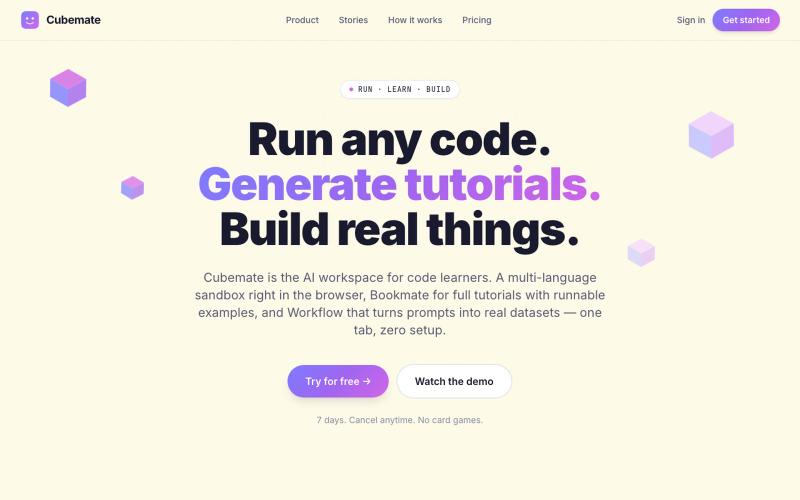
Cubemate - AI Code Learning Assistant
Write, execute, and learn code in Python, Java, JavaScript, C++, Go, and Rust.

@francis7_a · X
Building - learning tools for devs and student. happy to connect.
The full gallery
Tech stack
60 projects
Write, execute, and learn code in Python, Java, JavaScript, C++, Go, and Rust.
@francis7_a · X
Building - learning tools for devs and student. happy to connect.

Buy pixels on a shared digital canvas, inspired by the Million Dollar Homepage concept.
u/TheMenara · Reddit
Inspired by the guy who sold a million pixels for a buck each in 2005 — built my own version A while back I was thinking about the old Million Dollar Homepage story — guy sells a million pixels for $1 each in 2005, makes a million dollars, becomes a meme. I kept wondering if a simple, honest version of that idea could still work today, so I figured I'd give it a shot. It's called The Menara — a tower with 5,000 windows. $5 claims one, permanently. You pick your exact floor and unit, add a n
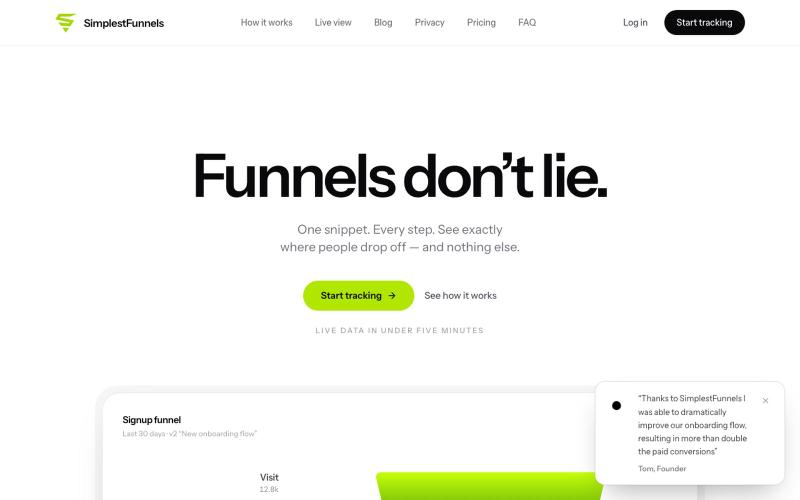
@zdogmode https://t.co/Cdk9FF9iPM - This is a tool I built and was really useful for my own projects, so I made it available.

@tpacker · X
- This is a tool I built and was really useful for my own projects, so I made it available.

Convert code into interactive flowcharts for learning, debugging, and documentation.

@Sparsh209 · X
Hi isha! Check it out here at: Would love to hear your feedbacks
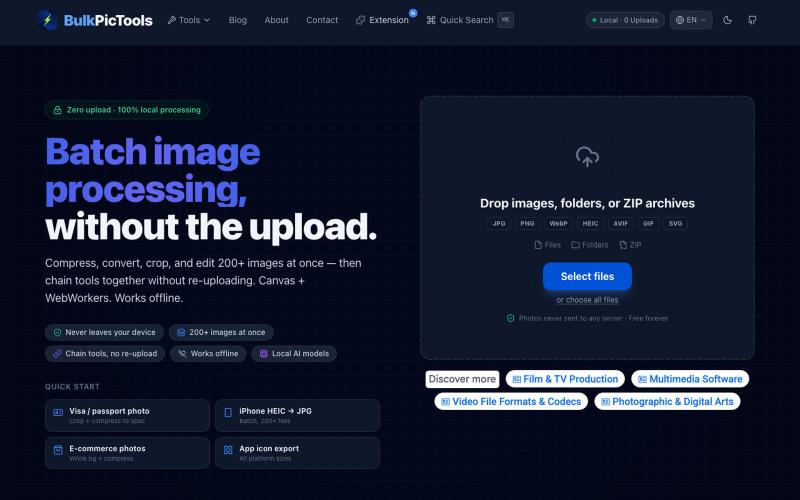
Batch edit images in your browser with tool chaining, compression, and format conversion.
BulkPicTools — 免费浏览器端图片批量处理工具,支持**工具链串联**(压缩→转格式→裁剪一次完成,无需重复上传),本地 AI 去背景/人脸模糊(WebGPU,无需 API Key),支持 200+ 张图片批量处理,文件不上传服务器。

A visualization language designed for AI agents to create and interact with charts.
chenglong-hn · HN
Data visualizations are the bridge between user and data. But building AI agents that can generate visualizations reliably can be very tricky: - simple chart specs can be reliable, but generated charts are often of low quality due to reliance on system defaults; - complex chart specs with explicit details can produce good-looking charts, but they are verbose and agents can struggle with reliability We figured out it is a limitation on the language issue (not just AI capability thing) -- current visualization languages are a bit too low-level for AI agents, requiring them to explicitly make visual decisions that are supposed to be handled by a good compiler. Flint is a visualization intermediate language to address this issue, allow AI agents to solve this last-mile human-agent interaction problem. It provides a simple semantic-type based specification, and contains a layout optimization engine that can produce good-looking charts (filled with derived low-level details) from simple

Generate production-ready HTML and Tailwind UIs by chatting with AI.

@AmberProgrammer · X
I am building an Ai powered ui generator that can generate Mobile App UI, Desktop App UI, Website UI & Responsive Web Design. Try it!

Open-source browser tool to generate UI prototypes, graphics, logos, and social media designs with AI.
MuseUI — 开源的纯浏览器运行的 AI 画布式图片工作台,可生成 UI 原型、文章封面、信息图、Logo、贴纸、社交媒体配图
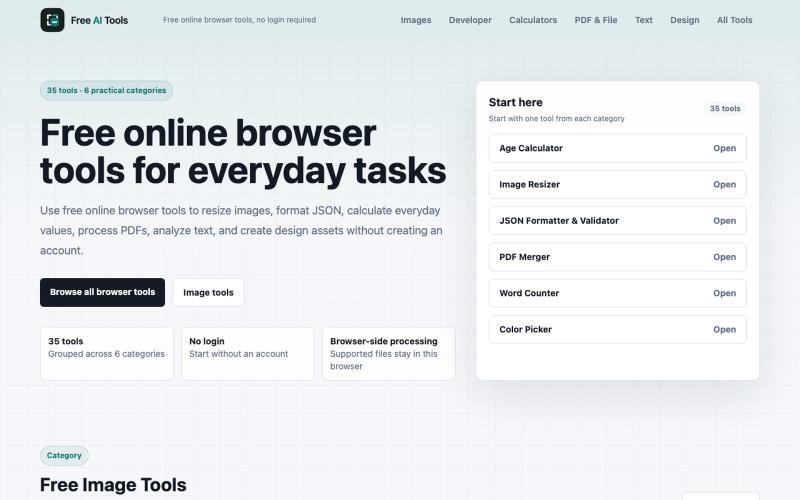
Free browser tools for image resizing, JSON formatting, PDF processing, text analysis, and design without login.
musekit · Product Hunt
Free AI Tools Free browser tools for everyday tasks, no login

Convert photos to realistic pencil art sketches using AI.

@_samuelaidoo · X
Getting users
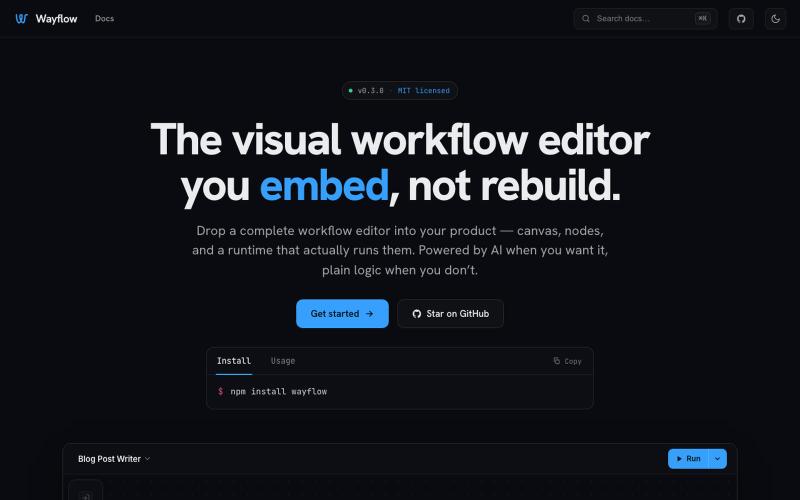
Embeddable visual workflow builder for web apps with optional AI assistance.
tahazsh · HN
Hi! I’m Taha. In many agentic products that support workflows (including one I worked on), I noticed they either don’t support node-based editors, or use React Flow and go through the difficult work of integrating it into their product to run it and work with their existing logic. So I thought about creating a tool that could help with this by closing the gap between the editor and the runtime. That’s why I created Wayflow. The basic architecture is simple: you just need to create a graph (which is a JSON object) that the runtime knows how to run. The runtime doesn’t care where that graph is coming from, it just needs the right schema. And with the help of the editor, you can create the graph, and then export it or directly save it on your backend in your database. And then when you want to execute it, you just hand it to the runtime. The runtime can either stream the execution (which is useful for the editor), or give you the final result. How you execute the graph is up to you: t
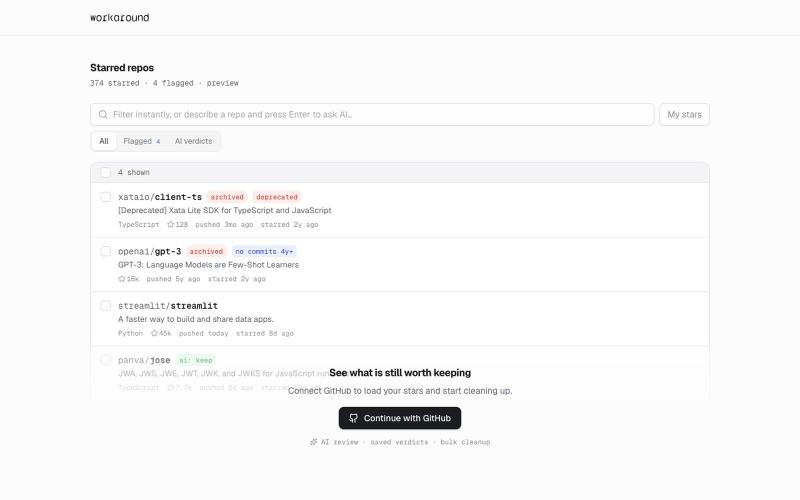
Browser tools for practical fixes to everyday software tasks, starting with GitHub.
yusveng · HN
Workaround – Unstar GitHub Repos in Bulk