
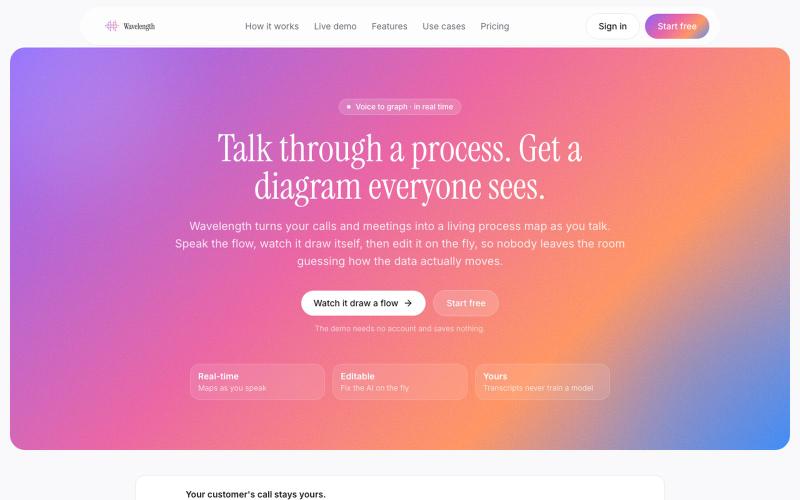
Creative Tools22 hours ago
Wavelength: Turn Voice and Transcripts Into Flow Diagrams
Wavelength turns your calls and meeting transcripts into a living process map as you talk. Speak the flow, watch it draw itself, then share it.

@WavelengthFlow · X
The full gallery
Tech stack
60 projects
Wavelength turns your calls and meeting transcripts into a living process map as you talk. Speak the flow, watch it draw itself, then share it.
@WavelengthFlow · X
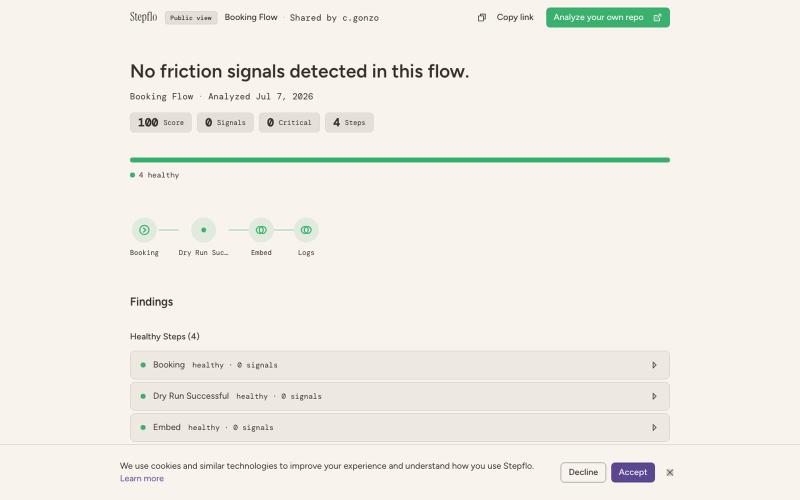
Connect a GitHub repo to automatically detect user flows, visualize code structure, and identify where users get stuck.
u/freestyle_gonzo · Reddit
Vibe coding made building fast. It didn't make understanding easy. Something changed in the last year. Vibe coding (or agentic engineering if you ask some) made writing an app fast. Week-to-weekend fast. More people are building software than ever before, and I think that's a genuinely good thing. But fast building creates a new bottleneck. Writing code is no longer the hard part. Understanding what you built and its nuances is. A huge share of people shipping right now have never analyzed

Free JavaScript library for adding scroll animations, parallax effects, and text animations to websites using HTML attributes.

@iamdeepak89 · X
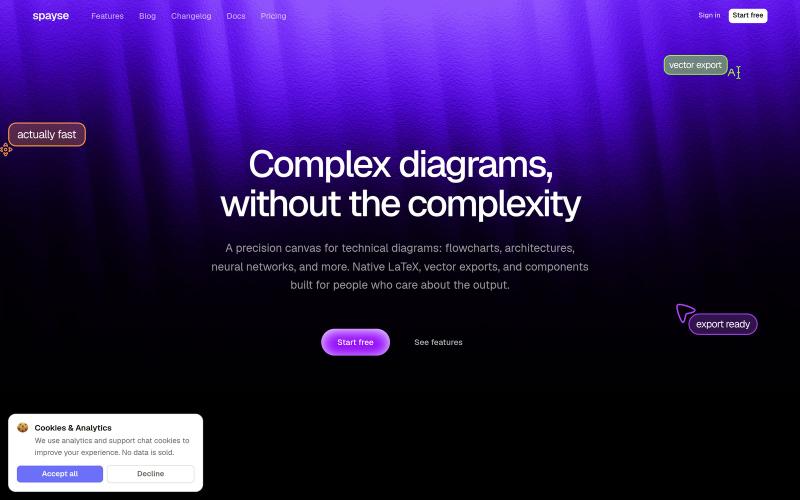
Spayse is a fast diagram canvas for flowcharts, system architecture, and technical figures. Native LaTeX, vector SVG and PDF exports.

@aakarshgoyall · X
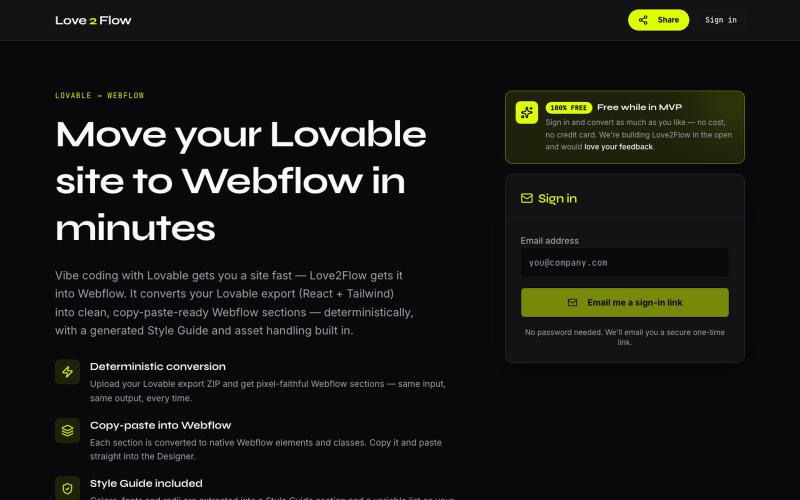
Convert Lovable React exports into paste-ready Webflow sections instantly.

@philippxroth · X
Turn your vibe-coded @Lovable site into clean, paste-ready Webflow sections. Upload your export, organize your migrations in projects, paste straight into @webflow. Free MVP. No password, no credit card — just a magic link and you're in. ✨
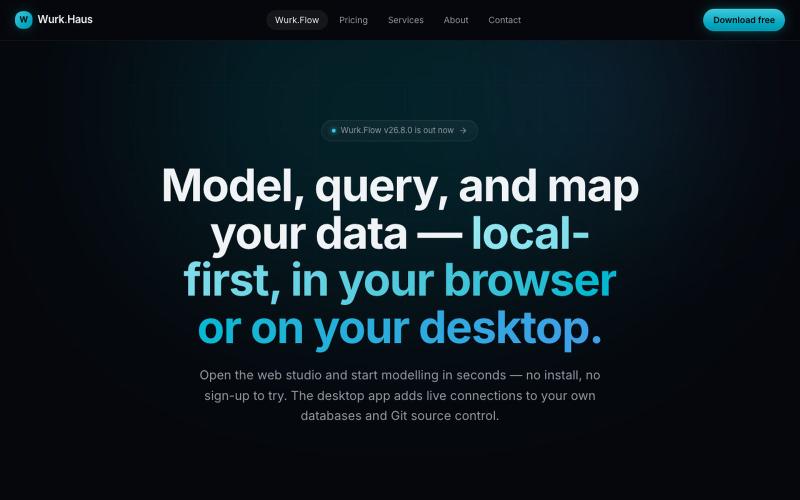
Wurk.Flow unifies schema design, a live SQL workspace, column-level lineage, and source-to-target mapping in one local-first modeling IDE — in your browser or on your desktop. Free

@WurkHaus · X
What happens when you got told no to a 3k quote for a data tool and spend a year building one instead.
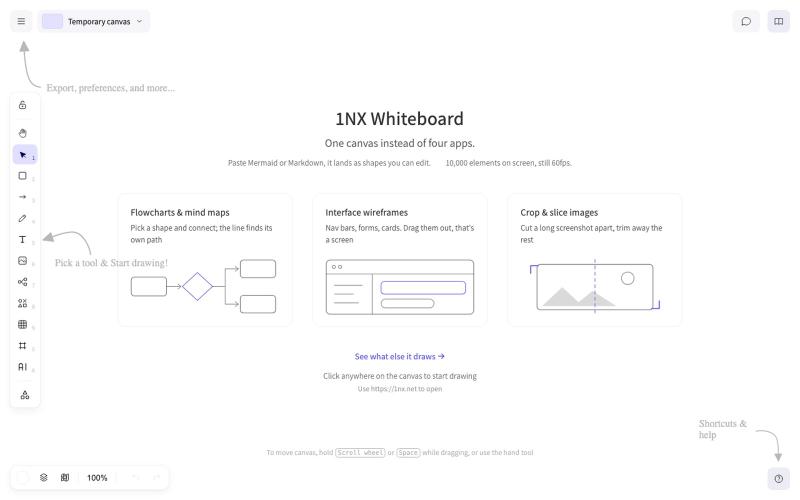
Collaborative whiteboard for wireframes, flowcharts, and process design — no signup needed.
veau · V2EX
[产品自荐] 基于 Excalidraw,我做了一个更顺手、更全能的纯本地白板: 1NX 作为产品民工+重度 Excalidraw 用户。 在 AI 的加持下,基于 Excalidraw 做了一个更顺自己手、更全能的纯本地白板:**1NX.NET** 访问地址: https://1nx.net/ **核心解决日常画图、画交互、读取各种文件轻量化处理的问题。** 产品能力概览: * 无须注册,打开即用。完整兼容 Excalidraw ,旧图可直接导入继续编辑 * 优化画布操作手感和交互,解决存储满的问题,大量元素上依然流畅 * 流程图、脑图、原型、文档、代码和图片都能放在同一张画布 * 支持 Axure 、XMind 、draw.io 、Visio 、Mermaid 、PlantUML 等格式直接导入 * 代码块、PDF 、Word 、PPT 、Excel 可直接摊开阅读;无需打开软件 * 图片裁剪、切片、马赛克、高清放大、智能抠图一站完成(全单机完成) * AI 生成思维导图、流程图、以及汇报级别的 PPTX * 增强本地化单文件能力,全
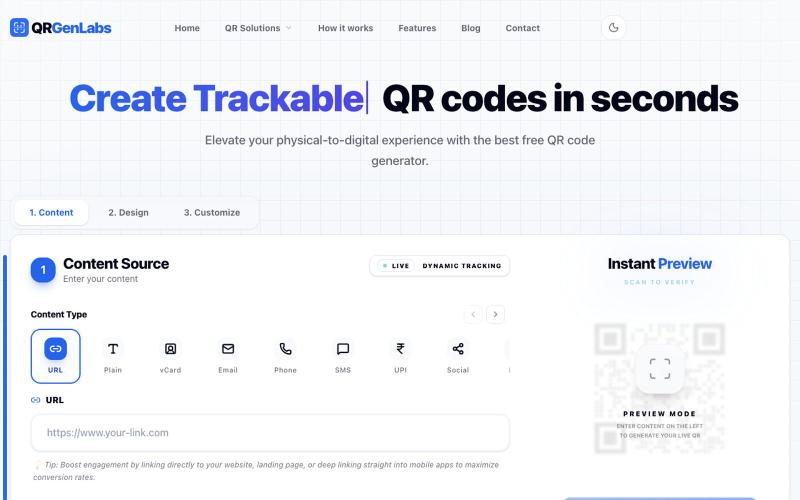
Generate and customize QR codes with logo insertion, tracking, and export to PNG or SVG.

@rahuld1506 · X
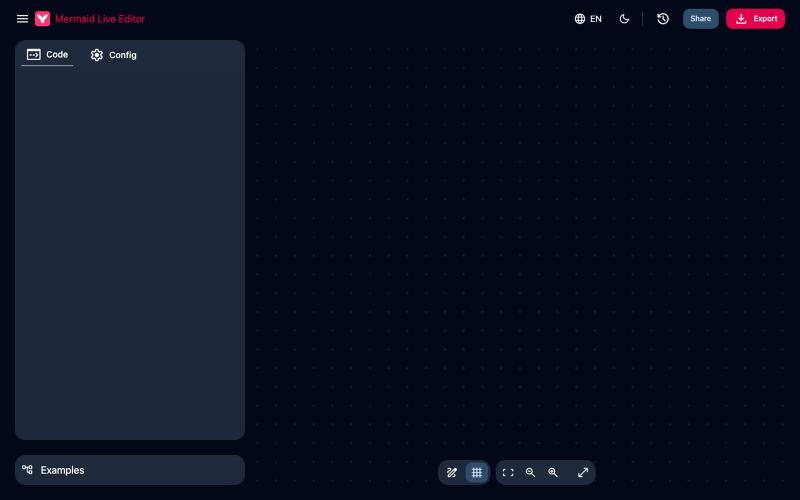
Draw Mermaid diagrams online with 33+ chart types, export to PNG/SVG/PDF.
kalman03 · V2EX
分享一个免费强大的在线 Mermaid 绘图工具 Mermaid Live Editor ( https://mermaid-live-editor.com/ ) 免费强大的在线 Mermaid 绘图工具。无需安装,支持 33+ 种图表类型(流程图、时序图、架构图等)实时渲染,纯前端运行不上传代码,支持导出 PNG/SVG/PDF 格式。
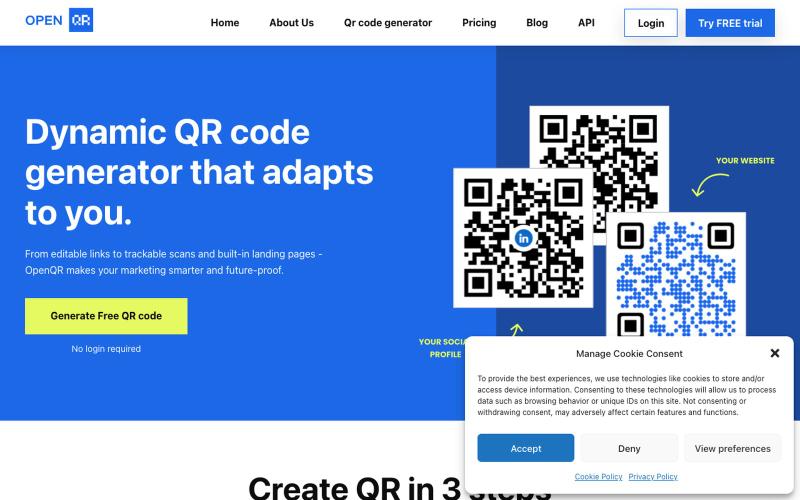
Generate dynamic QR codes with custom logos, colors, and usage tracking.

@IfeanyiArinze10 · X
What does What makes it unique?
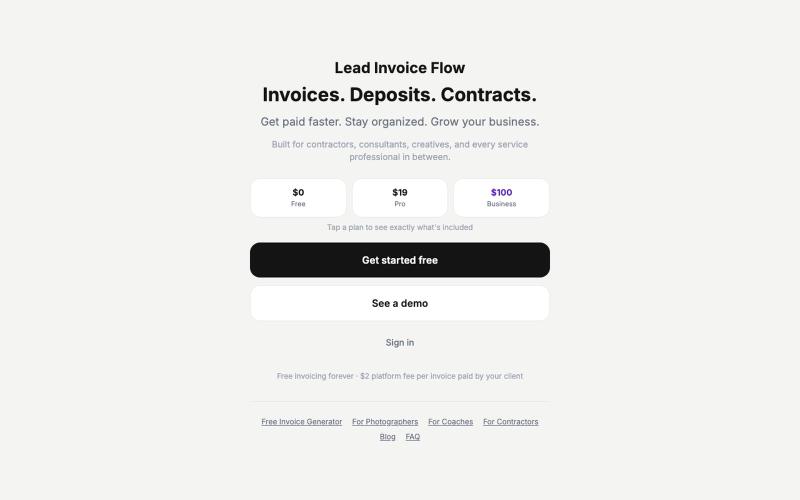
Send invoices, collect deposits, and get e-signed contracts — free to start. Lead Invoice Flow is the simple invoicing app built for photographers, contractors, coaches, and indepe

@marketmaxing · X
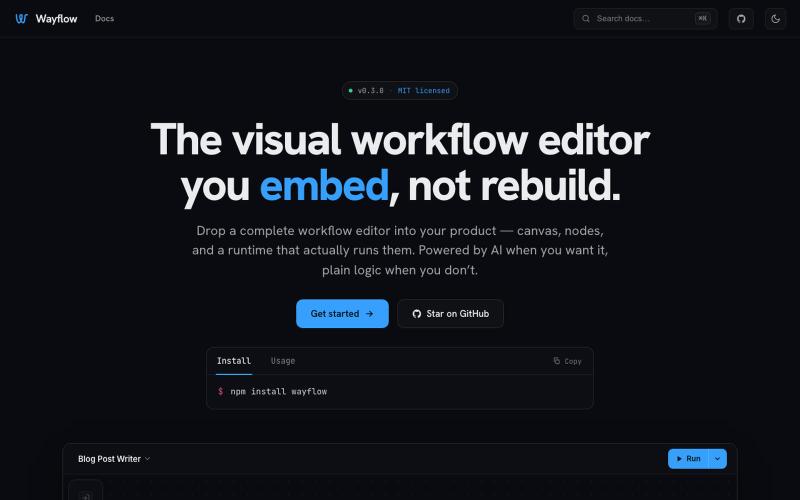
Embeddable visual workflow builder for web apps with optional AI assistance.
tahazsh · HN
Hi! I’m Taha. In many agentic products that support workflows (including one I worked on), I noticed they either don’t support node-based editors, or use React Flow and go through the difficult work of integrating it into their product to run it and work with their existing logic. So I thought about creating a tool that could help with this by closing the gap between the editor and the runtime. That’s why I created Wayflow. The basic architecture is simple: you just need to create a graph (which is a JSON object) that the runtime knows how to run. The runtime doesn’t care where that graph is coming from, it just needs the right schema. And with the help of the editor, you can create the graph, and then export it or directly save it on your backend in your database. And then when you want to execute it, you just hand it to the runtime. The runtime can either stream the execution (which is useful for the editor), or give you the final result. How you execute the graph is up to you: t