
Creative Tools1 month ago
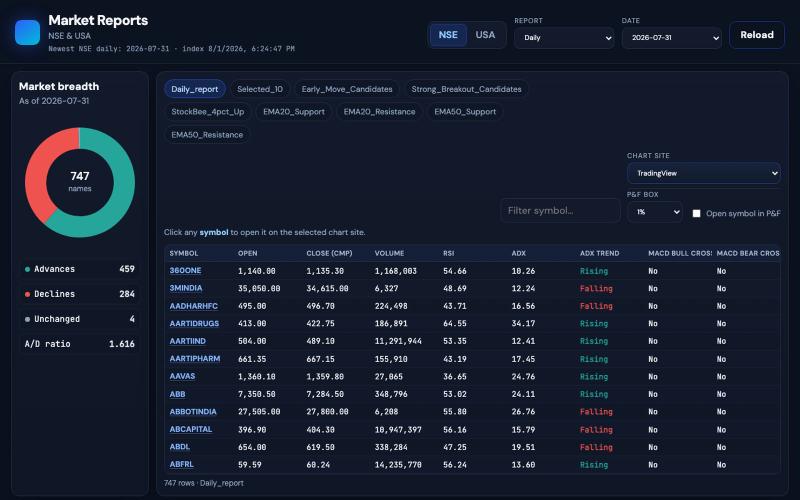
Market Reports
@jacobAlswin Point and figure chart US stock https://t.co/LiS8OfbhKj

@neha041187 · X
Point and figure chart US stock
The full gallery
Tech stack
60 projects
@jacobAlswin Point and figure chart US stock https://t.co/LiS8OfbhKj
@neha041187 · X
Point and figure chart US stock
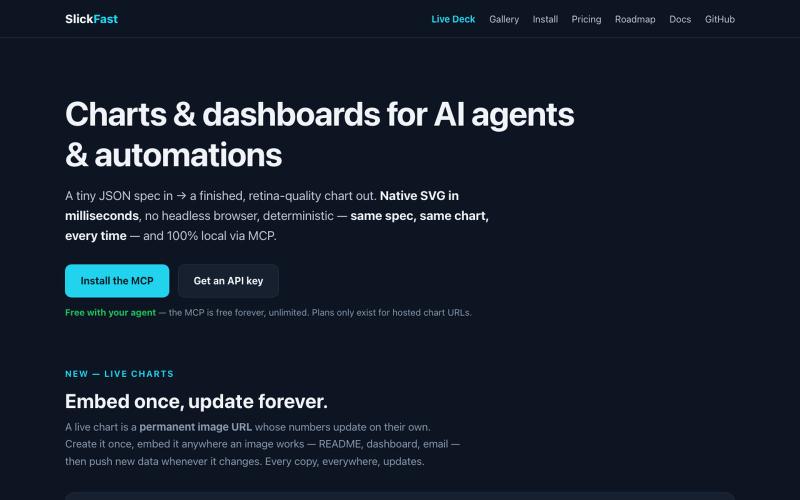
Create charts and dashboards from JSON specs for AI agents and automations.

@SlickFastHQ · X
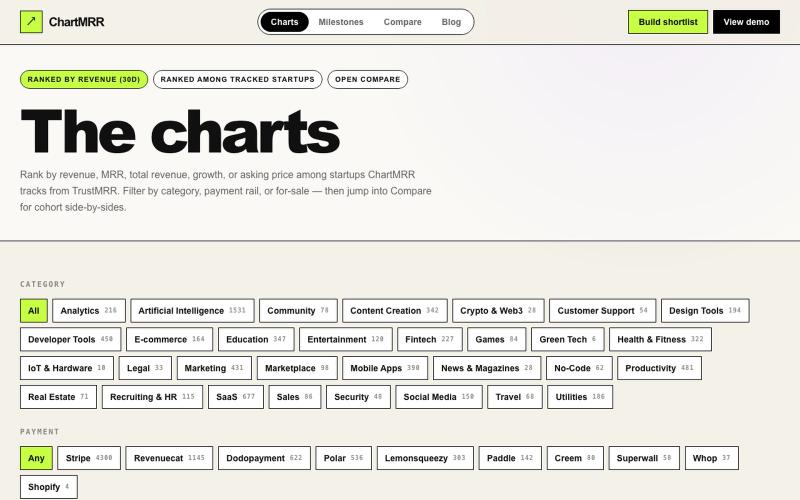
Browse verified revenue charts sorted by 30-day performance and category.

@gimafore · X
Market intelligence on verified revenue, see how much it takes to get ROI when you acquire a startup
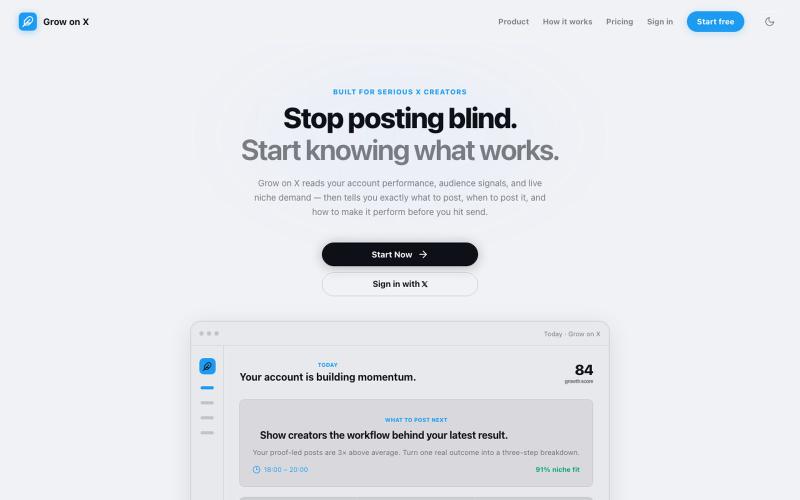
Analyzes your X account data and trends to create a personalized creator growth plan.

@Grow0nX · X
- Best X content creator friend/tool
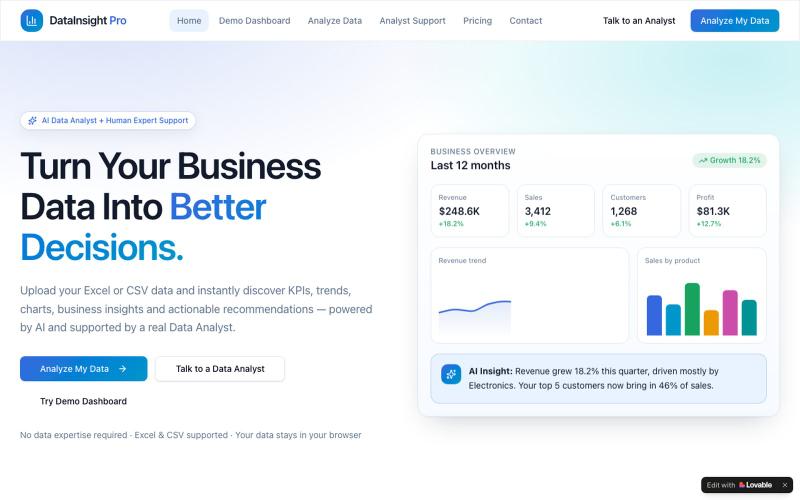
Upload Excel or CSV data to instantly get KPIs, dashboards, charts and AI business insights.

@TridipBiswasdip · X
Check out what I just built with Lovable!
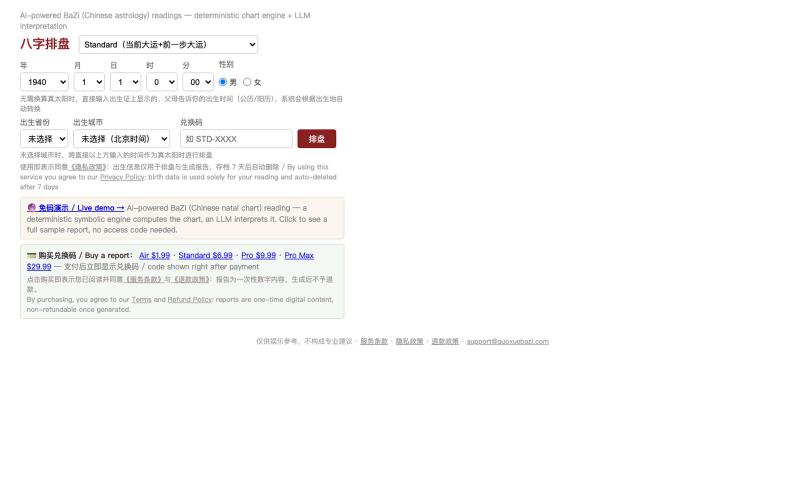
AI-powered Bazi natal chart reader using rule-based calculations and LLM-generated natural language interpretation.

@GoWithFlow2026 · X
上线了一个 AI 八字排盘 🔮 🔗 和"直接把生日扔给 ChatGPT"完全不同: 1️⃣ 事实不靠猜:排盘、干支关系、刑冲合会等,全部由确定性规则引擎计算——LLM 只负责把判定结果写成人话,编不了盘。 2️⃣ 指令手写:分析指令是我根据《子平真诠》并结合自身经历逐条手写的命理逻辑。 🎁 免费演示,无需注册,点开即看完整报告: 觉得准,再测自己的($1.99 起)。欢迎反馈!
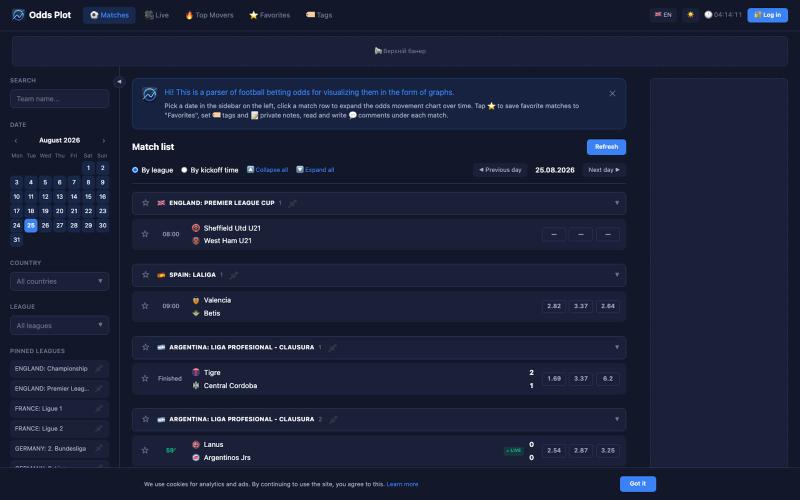
Track bookmaker odds movement, save favorite matches, add tags and notes, read community comments.

@OddsPlot · X
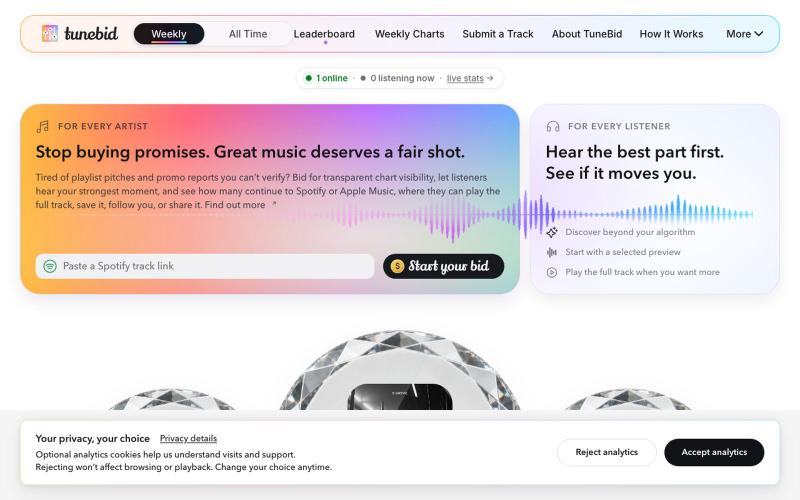
Submit a track to bid for transparent chart visibility and track listener conversions.

@tunebidapp · X
Congrats, Mark! 🎉 I can’t code, but I just launched TuneBid entirely through Vibe Coding. I’m using @DataFast_ for analytics and love how simple and transparent it is. Artists can submit a track from $5 and choose their best 60 seconds. 🎧
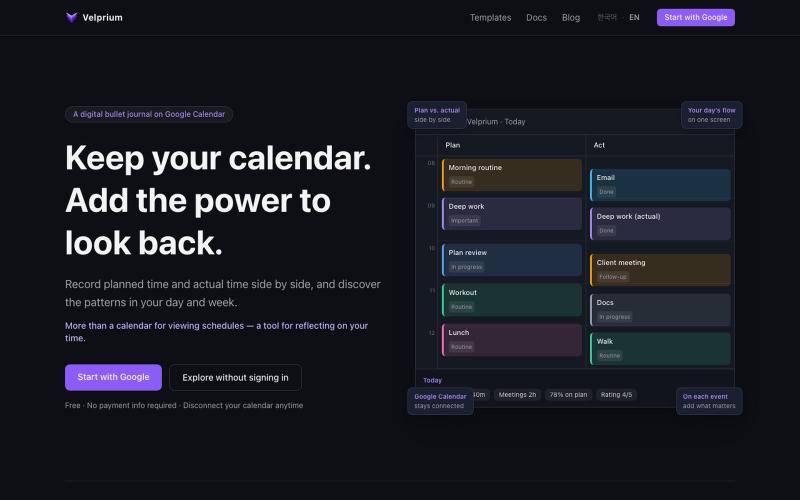
Add status, tags, and ratings to calendar events and track time usage with weekly/monthly reports.
mjkl7896 · HN
Velprium - Time Workspace
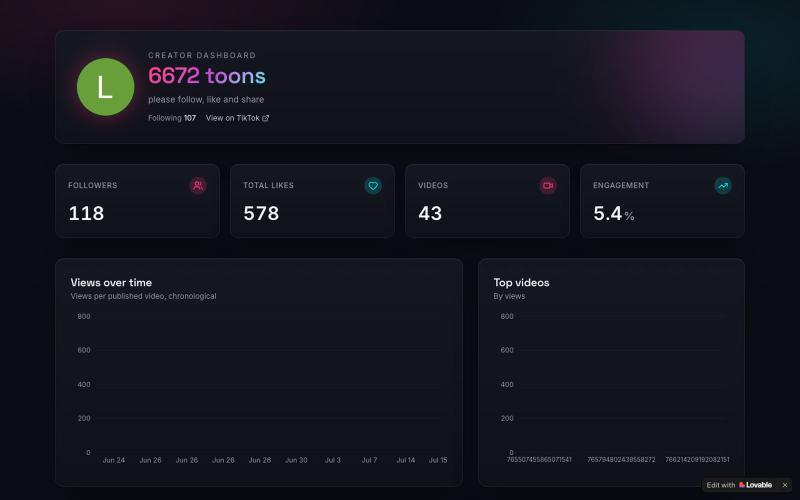
Track your TikTok analytics, followers, likes, and video performance in one dashboard.

@BBMax244185 · X
Check out what I just built with Lovable!

A visualization language designed for AI agents to create and interact with charts.
chenglong-hn · HN
Data visualizations are the bridge between user and data. But building AI agents that can generate visualizations reliably can be very tricky: - simple chart specs can be reliable, but generated charts are often of low quality due to reliance on system defaults; - complex chart specs with explicit details can produce good-looking charts, but they are verbose and agents can struggle with reliability We figured out it is a limitation on the language issue (not just AI capability thing) -- current visualization languages are a bit too low-level for AI agents, requiring them to explicitly make visual decisions that are supposed to be handled by a good compiler. Flint is a visualization intermediate language to address this issue, allow AI agents to solve this last-mile human-agent interaction problem. It provides a simple semantic-type based specification, and contains a layout optimization engine that can produce good-looking charts (filled with derived low-level details) from simple
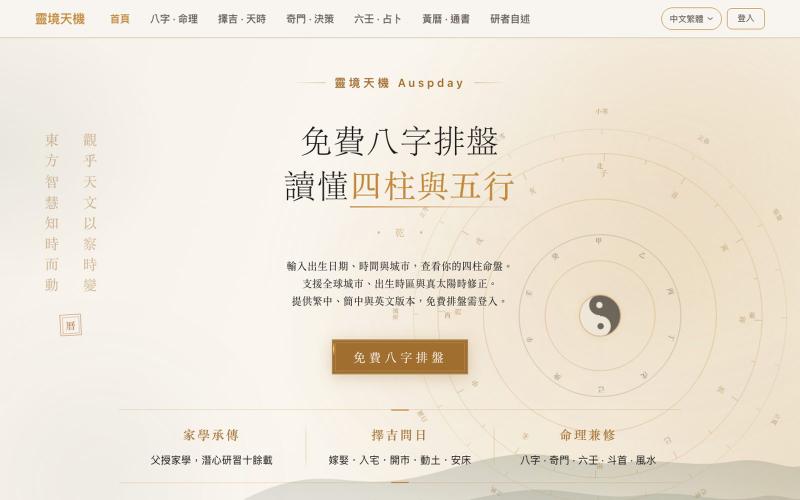
Generate personalized Bazi charts from your birth date, time, and location.

@JohnSmistejbf · X
做了一个在线八字排盘工具。 输入出生时间,就可以快速生成八字命盘,查看四柱、五行、十神等信息。 欢迎反馈,我会继续优化。