

开发者工具1 month ago
CodeFlovio | Code to Flowchart & Algorithm Visualizer Tool
CodeFlovio 将代码转换为交互式流程图,便于学习、调试和文档编制。

@Sparsh209 · X
Hi isha! Check it out here at: Would love to hear your feedbacks
完整作品展
技术栈
60 projects
CodeFlovio 将代码转换为交互式流程图,便于学习、调试和文档编制。
@Sparsh209 · X
Hi isha! Check it out here at: Would love to hear your feedbacks

AI 图像编辑与生成工具,在浏览器和移动设备上编辑和扩展图像。
visuali · HN
Like Claude Code for Images
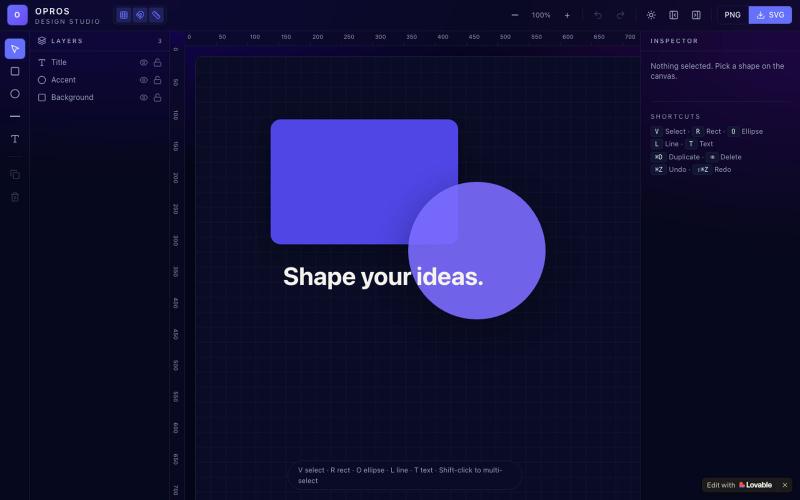
在网络上创建和可视化设计的创意工作室OPROS Design Studio。

@OprosOlamiflex · X
Check out what I just built with Lovable!

Flint是为AI代理设计的可视化语言,用于创建交互式数据可视化。
chenglong-hn · HN
Data visualizations are the bridge between user and data. But building AI agents that can generate visualizations reliably can be very tricky: - simple chart specs can be reliable, but generated charts are often of low quality due to reliance on system defaults; - complex chart specs with explicit details can produce good-looking charts, but they are verbose and agents can struggle with reliability We figured out it is a limitation on the language issue (not just AI capability thing) -- current visualization languages are a bit too low-level for AI agents, requiring them to explicitly make visual decisions that are supposed to be handled by a good compiler. Flint is a visualization intermediate language to address this issue, allow AI agents to solve this last-mile human-agent interaction problem. It provides a simple semantic-type based specification, and contains a layout optimization engine that can produce good-looking charts (filled with derived low-level details) from simple

用AI驱动的审计工具分析系统,包含多个版本。

@jozef_x1 · X
🚨 I Vibe Coded F0ur (4) different versions of @coreyganim's "Ai Audit" Funnel, which is your favourite? VERSION #3:

构建AI智能体并在交互式仪表板上实时可视化其执行。

@Aurelsuuu · X
this is my product, come take a look:
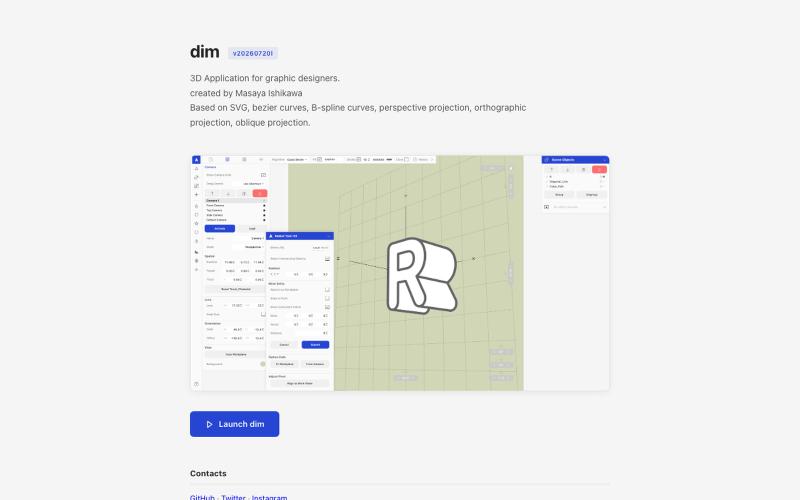
从 Adobe Illustrator 导入 2D 路径,在 3D 中变换并以矢量格式导出。

@kamone · X
I built (vibe coded) my own geometry engine from scratch. It keeps path as path, and does the transformation and the silhouette splitting. You can see the code here. One single html file.
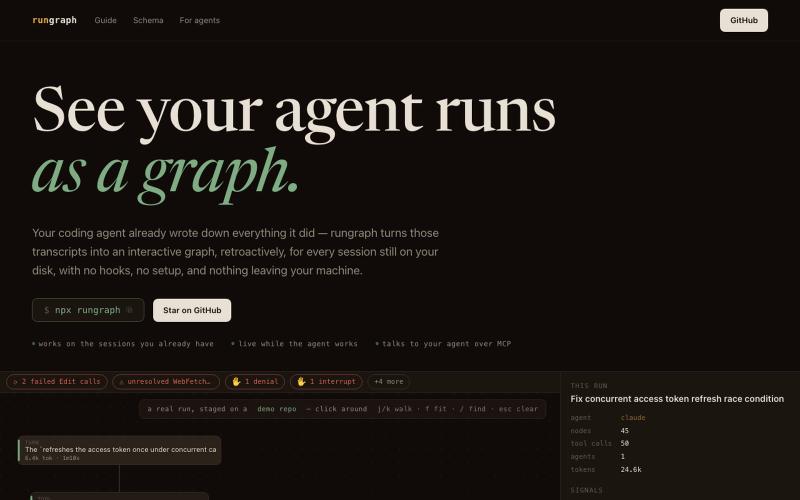
将 AI 编码代理的运行转录可视化为交互式图表。
u/Express-Phase1532 · Reddit
rungraph - see what your coding agent actually did, as an interactive graph (open source) My coding agent kept doing 20 minutes of work I couldn't inspect afterward. The transcript exists (Claude Code and Codex CLI write everything to disk), but nobody reads 4,000 lines of JSON. So I built rungraph, open source and free (MIT). npx rungraph turns every session on your machine into a clickable graph: your prompts run down the spine, subagents get their own lanes, and it flags stuff like ret
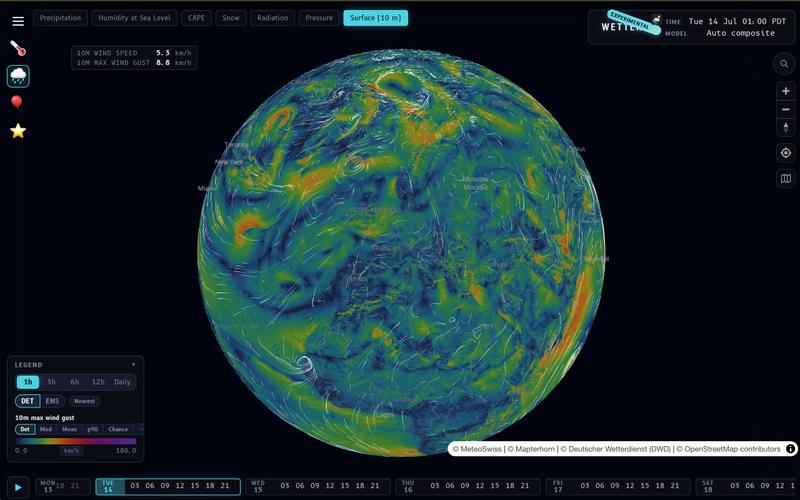
Wetter 支持本地计算和自定义聚合模式的天气预报和可视化应用。
__mp · HN
I built my own weather prediction / visualization app: https://wx.rsp.li (on-device temperature lapsing, on device interpolation modes, user-selectable aggregations, etc…). One of these days I should do a writeup. I also asked Claude to build a photo gallery for me https://places.pascalspoerri.ch (HDR, map support, similar images)

Visual Wizard 是一个视觉工作空间,与编程AI代理实时设计工作原型。
u/tokmako · Reddit
I am developing an alternative work environment to Claude Design. When I first tried Claude Design, I really liked the idea. But after generating a design, I kept wanting a more direct way to continue working on it not as a separate design representation, but as a live, working interface. That’s what I’m building with VisualWizard. The canvas contains real, interactive prototypes. You can select elements directly, move or resize them, change styles, and keep interactions and
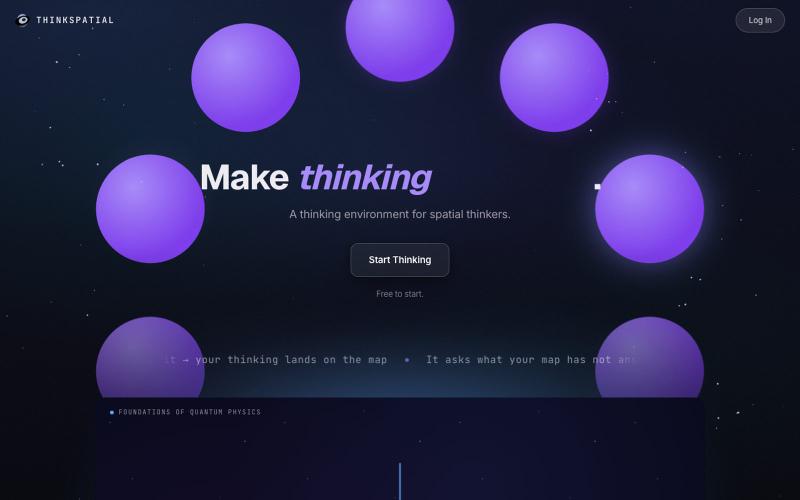
将想法组织为视觉地图,提取关键见解并转化为文档和演讲稿。
u/shadowosa1 · Reddit
I rebuilt my landing page after 300+ visitors still didn’t understand what my app does. I’ve been building a spatial thinking environment called ThinkSpatial, and one of the hardest parts hasn’t been building the product. It’s been explaining what it is in the first few seconds. The basic idea is simple. You speak or type, and your thinking gets turned into a visual map instead of disappearing into a chat box, doc, or note-taking app. My first landing page was way too focused on showing h

向应用添加小部件,自动捕获用户报告错误时的截图、控制台日志和网络错误。

@markoradotme · X