

AI 智能体1 week ago
Vatel AI - AI Voice Agents
用可视化编辑器构建和部署AI语音智能体,无需编码。

@mattcabral_ · X
looking for honest feedback from devs
完整作品展
技术栈
60 projects
用可视化编辑器构建和部署AI语音智能体,无需编码。
@mattcabral_ · X
looking for honest feedback from devs

Flint是为AI代理设计的可视化语言,用于创建交互式数据可视化。
chenglong-hn · HN
Data visualizations are the bridge between user and data. But building AI agents that can generate visualizations reliably can be very tricky: - simple chart specs can be reliable, but generated charts are often of low quality due to reliance on system defaults; - complex chart specs with explicit details can produce good-looking charts, but they are verbose and agents can struggle with reliability We figured out it is a limitation on the language issue (not just AI capability thing) -- current visualization languages are a bit too low-level for AI agents, requiring them to explicitly make visual decisions that are supposed to be handled by a good compiler. Flint is a visualization intermediate language to address this issue, allow AI agents to solve this last-mile human-agent interaction problem. It provides a simple semantic-type based specification, and contains a layout optimization engine that can produce good-looking charts (filled with derived low-level details) from simple
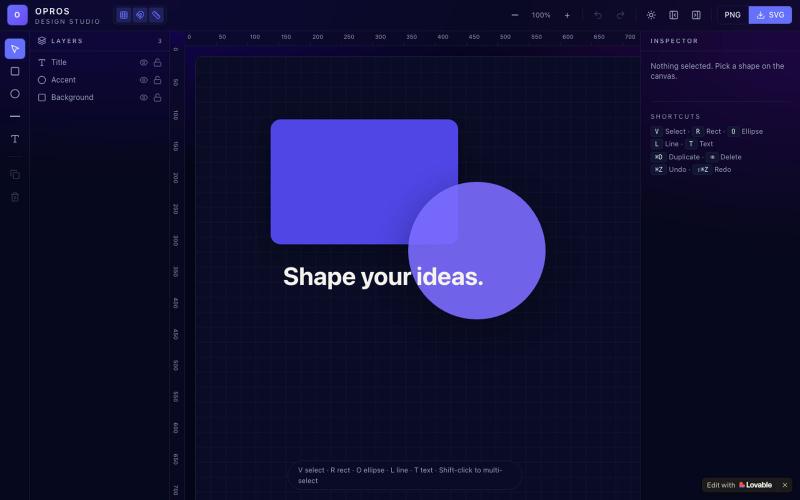
在网络上创建和可视化设计的创意工作室OPROS Design Studio。

@OprosOlamiflex · X
Check out what I just built with Lovable!
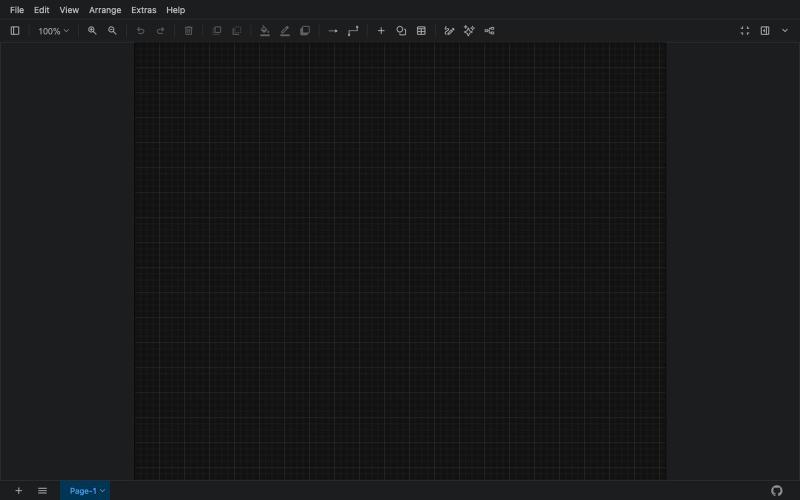
创建流程图、程序图、组织架构和UML图的免费在线工具。

@N0V4Dev · X
I found a tool called Next AI that links AI capabilities directly with diagrams. It lets you build and edit diagrams using natural language prompts instead of clicking around the canvas manually. It's a handy way to sketch out architecture when you don't want to drag every box yourself. The project is built on TypeScript with React 19 and Next.js. It supports multiple AI providers and even includes an MCP Server. This means you can use it with the Claude Code CLI to generate diagrams from your terminal. Deployment options are flexible too. You can run the tool locally with Docker or push it to Vercel and Cloudflare Workers. It supports multi provider setups so you can pick the backend that fits your workflow. #Nextjs #AI #Diagrams #TypeScript
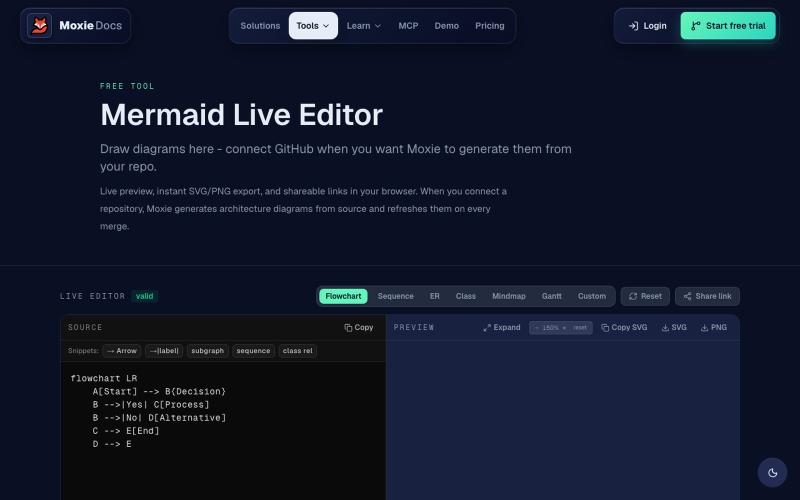
在线创建和导出流程图、序列图、实体关系图等 Mermaid 图表。
ghosts_ · HN
I've been slowly adding some new free tools to Moxie Docs (partly for SEO, partly to illustrate some of our feature sets before any commitment) for some reason this mermaid editor one blew up on Google rankings so I figured I'd share in case people find it useful! We also have ADR, AGENTS.md, LLMs, and a few other free tools.
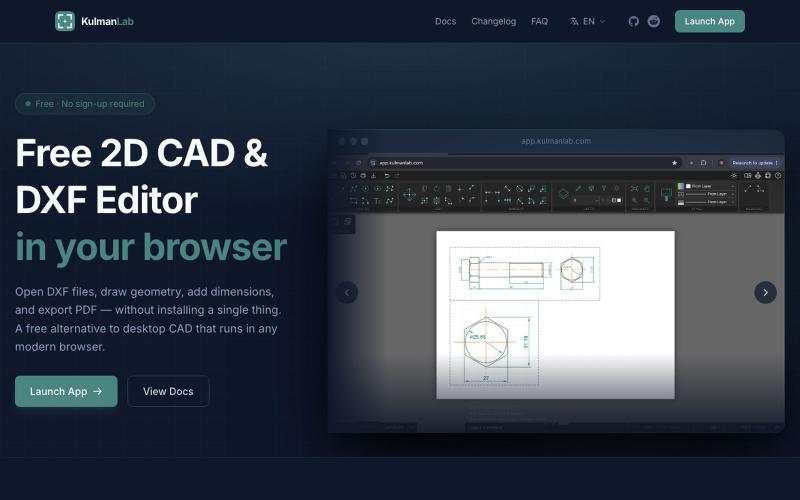
在浏览器中绘制和编辑2D CAD设计,导出为DXF或PDF,无需安装或登录。

@KulmanLab · X
- a free and accountless alternative to Autocad

Vidmo 是浏览器 AI 视频编辑器,从提示词创建动画视频,支持关键帧、效果和配音编辑。
u/Savings_Wolverine408 · Reddit
turns out you can make launch videos in the browser now! turns out you can make launch videos in the browser now, and Claude Opus is doing the heavy part we have been working on vidmo.app , a free browser based motion design editor for making product videos, launch clips, social ads, and simple motion graphics without opening After Effects. the idea is not to make another AI video toy where you type one prompt and get stuck with whatever comes out. the editor works more lik

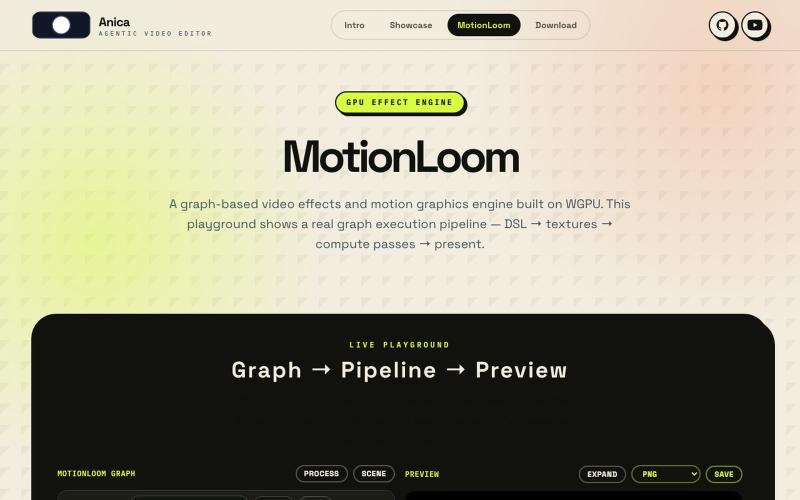
通过可视化图表和代码界面创建GPU加速的视频效果和动态图形。
LOVELYZOMBIEYHO
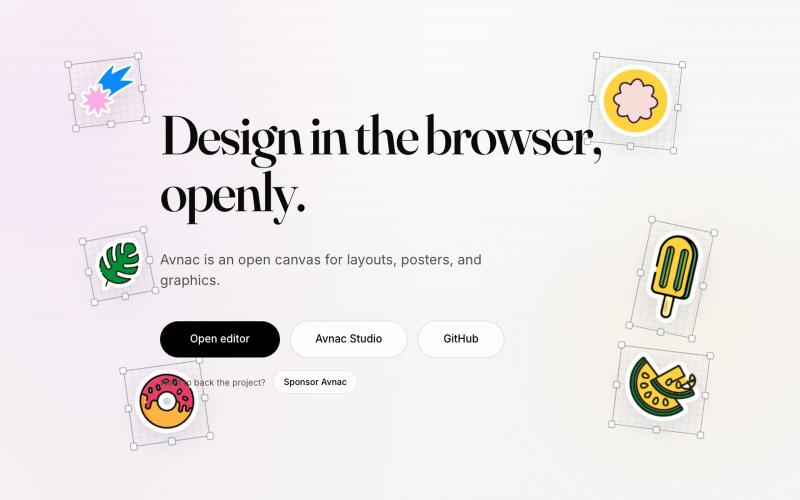
Avnac 是一个开源设计工具,可在浏览器中创建图形。

@akinkunmi · X
He trash-talked me and my amazing project ( unprovoked while all his projects are vibe-coded slop. That's why I named him King of Slop.
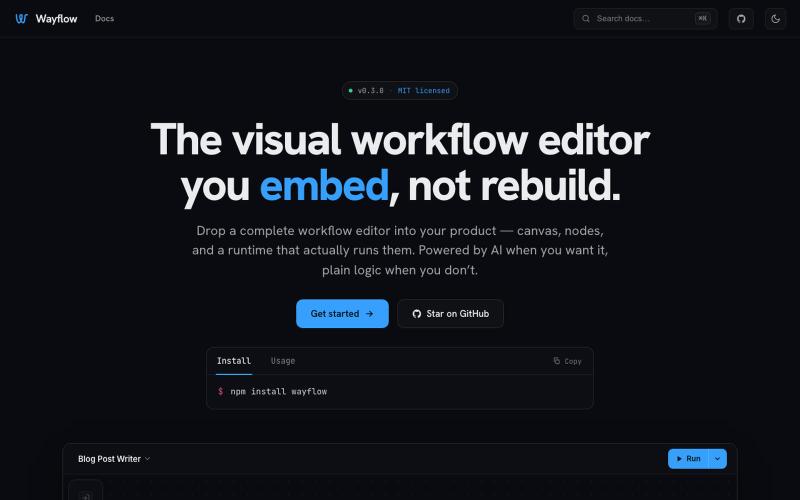
可嵌入的可视化工作流编辑器,支持AI驱动或纯逻辑设计。
tahazsh · HN
Hi! I’m Taha. In many agentic products that support workflows (including one I worked on), I noticed they either don’t support node-based editors, or use React Flow and go through the difficult work of integrating it into their product to run it and work with their existing logic. So I thought about creating a tool that could help with this by closing the gap between the editor and the runtime. That’s why I created Wayflow. The basic architecture is simple: you just need to create a graph (which is a JSON object) that the runtime knows how to run. The runtime doesn’t care where that graph is coming from, it just needs the right schema. And with the help of the editor, you can create the graph, and then export it or directly save it on your backend in your database. And then when you want to execute it, you just hand it to the runtime. The runtime can either stream the execution (which is useful for the editor), or give you the final result. How you execute the graph is up to you: t
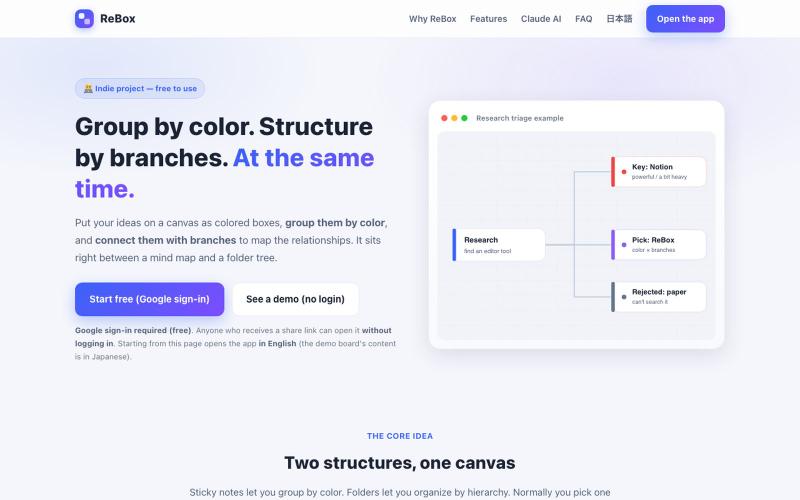
创建用颜色分组和分支结构的视觉看板,支持无需登录分享。

@shiftibis · X
Indie project 📝 ReBox: visual boards where color = group and branches = a file tree — both at once. Share links open without login (anyone with the link can edit). A Claude connector builds boards for you. English UI just shipped. #buildinpublic
