
创意工具1 month ago
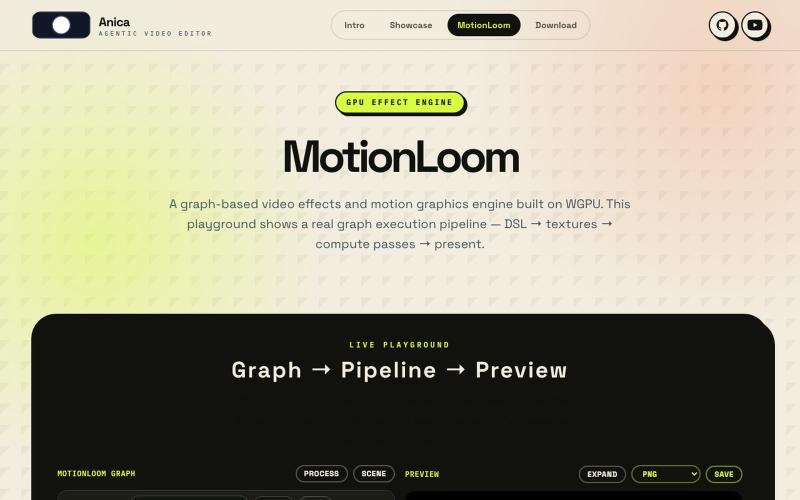
MotionLoom - GPU Effect Engine
通过可视化图表和代码界面创建GPU加速的视频效果和动态图形。
Open source
LOVELYZOMBIEYHO
完整作品展
技术栈
61 projects
通过可视化图表和代码界面创建GPU加速的视频效果和动态图形。
LOVELYZOMBIEYHO

用可视化编辑器构建和部署AI语音智能体,无需编码。

@mattcabral_ · X
looking for honest feedback from devs

charts.art 用实时交易所数据呈现的 3D 加密货币市场可视化。

@zacxbt · X
my current apps: • j******** (redacted) • @irigenerative (my first nft) • non-crypto saas app • penis game • blockrunner (my endless runner iOS app posted a vid a week ago) • petwidge (per iOS app) • nftwidge (nft gallery iOS app) • (pretty charts) • @perpspet (3d gamified perps) • (gamified bridge) • crypto twitter social app (don’t want to spoil the details) • portfolio pet game where the character is your portfolio, you feed him coins and he grows/evolves • (first app i ever vibe coded in dec) • onchain jam (nba jam 2v2 game but each team is a chain ex: base team = brian + jesse) • waffle world (3d waffle platformer lol) - 3d social trenches game

Flint是为AI代理设计的可视化语言,用于创建交互式数据可视化。
chenglong-hn · HN
Data visualizations are the bridge between user and data. But building AI agents that can generate visualizations reliably can be very tricky: - simple chart specs can be reliable, but generated charts are often of low quality due to reliance on system defaults; - complex chart specs with explicit details can produce good-looking charts, but they are verbose and agents can struggle with reliability We figured out it is a limitation on the language issue (not just AI capability thing) -- current visualization languages are a bit too low-level for AI agents, requiring them to explicitly make visual decisions that are supposed to be handled by a good compiler. Flint is a visualization intermediate language to address this issue, allow AI agents to solve this last-mile human-agent interaction problem. It provides a simple semantic-type based specification, and contains a layout optimization engine that can produce good-looking charts (filled with derived low-level details) from simple

AI 图像编辑与生成工具,在浏览器和移动设备上编辑和扩展图像。
visuali · HN
Like Claude Code for Images
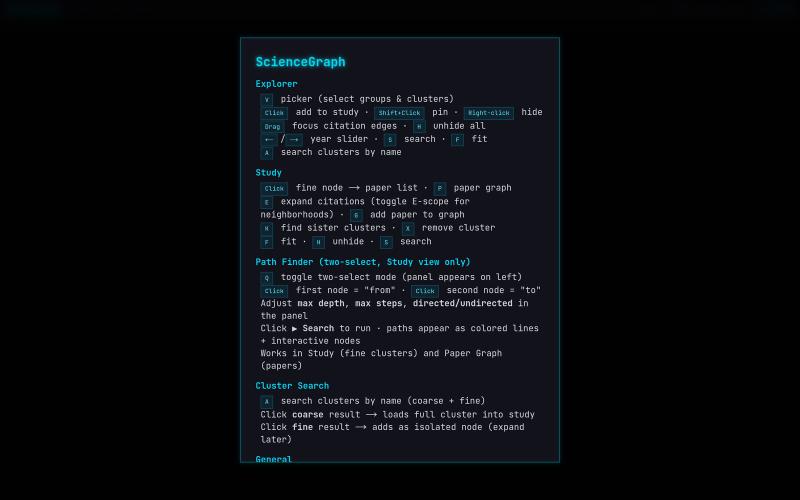
科学引文网络与论文的交互式WebGL可视化。

@lushptr · X
I feel really guilty for vibe coding this but it looks cool even tho it is really inefficient and broken you can use it too now I'll desloppify it after exams I swear
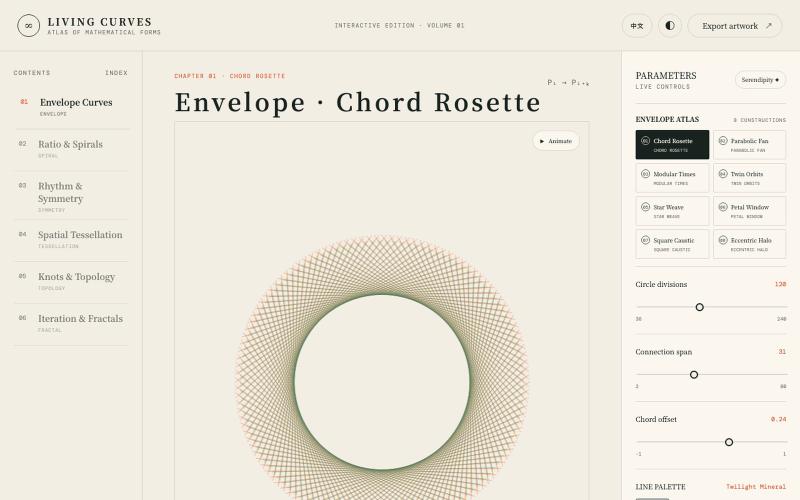
探索数学曲线、分形、对称和拓扑的交互式可视化。

@vkuoo · X
Added more demos showcasing graph-math relationships, built with Codex.
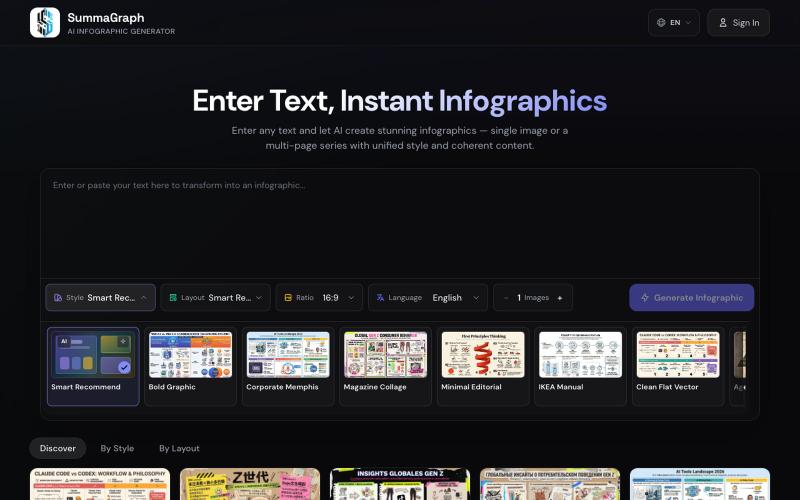
Summagraph 用 AI 将文本转换为信息图,提供 17 种风格和 20 种布局选择。
SummaGraph — AI 信息图生成工具,粘贴任意形式的文本即可一键生成高质量信息图,内置 20 种视觉风格 × 20 种布局模板,支持系列模式一次生成多页风格连续的信息图,覆盖中英日韩等 9 种语言

CodeFlovio 将代码转换为交互式流程图,便于学习、调试和文档编制。

@Sparsh209 · X
Hi isha! Check it out here at: Would love to hear your feedbacks

LSBattle实时展示BTC/ETH/SOL期货市场多空战场可视化。
flreey · V2EX
模拟 btc/eth/sol 多空军沙盘效果 https://w3arb.xyz/ 其他地方看到的创意,我觉得很有意思,模拟币圈多军/空军对战场景 底部还可以发弹幕,聊天
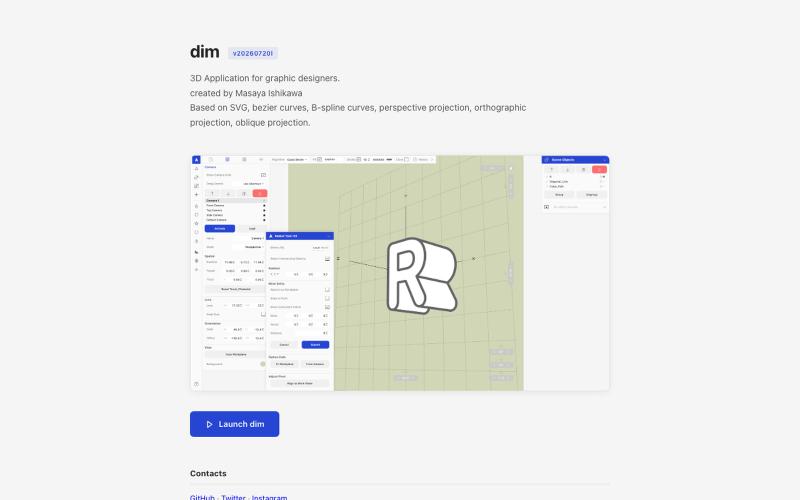
从 Adobe Illustrator 导入 2D 路径,在 3D 中变换并以矢量格式导出。

@kamone · X
I built (vibe coded) my own geometry engine from scratch. It keeps path as path, and does the transformation and the silhouette splitting. You can see the code here. One single html file.
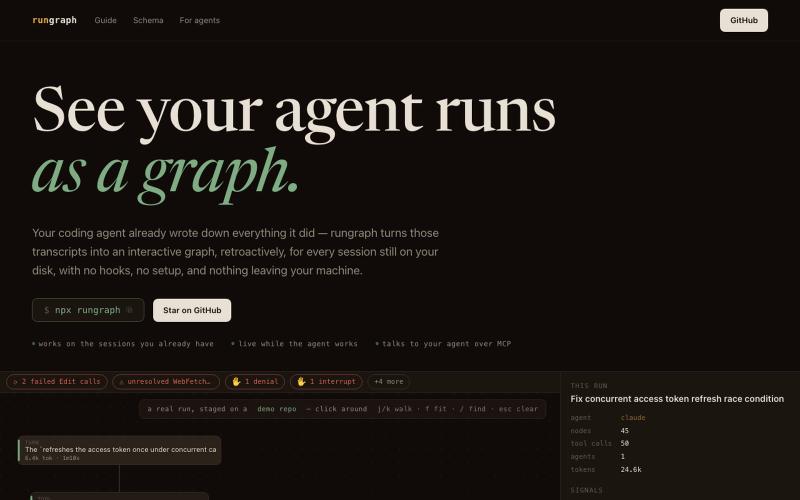
Zero-setup visualizer for AI coding-agent runs. npx rungraph turns the transcripts already on your disk into an interactive graph — live, local, agent-readable.
u/Express-Phase1532 · Reddit
rungraph - see what your coding agent actually did, as an interactive graph (open source) My coding agent kept doing 20 minutes of work I couldn't inspect afterward. The transcript exists (Claude Code and Codex CLI write everything to disk), but nobody reads 4,000 lines of JSON. So I built rungraph, open source and free (MIT). npx rungraph turns every session on your machine into a clickable graph: your prompts run down the spine, subagents get their own lanes, and it flags stuff like ret