

开发者工具1 month ago
CodeFlovio | Code to Flowchart & Algorithm Visualizer Tool
CodeFlovio 将代码转换为交互式流程图,便于学习、调试和文档编制。

@Sparsh209 · X
Hi isha! Check it out here at: Would love to hear your feedbacks
完整作品展
技术栈
60 projects
CodeFlovio 将代码转换为交互式流程图,便于学习、调试和文档编制。
@Sparsh209 · X
Hi isha! Check it out here at: Would love to hear your feedbacks
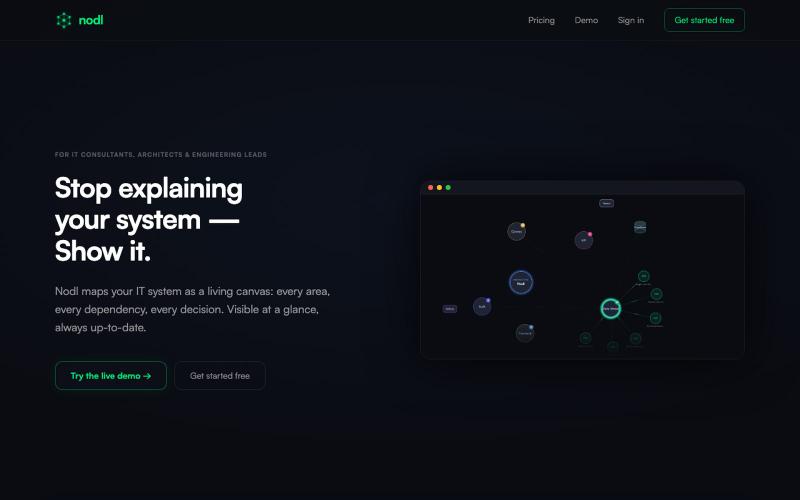
创建与 Jira 自动同步的 IT 系统架构可视化地图。

@erelof1 · X
Nodl ( Automates visual system architecture maps directly from live Jira sync, so dev teams never have to manually draw outdated diagrams in Lucidchart or Confluence again.
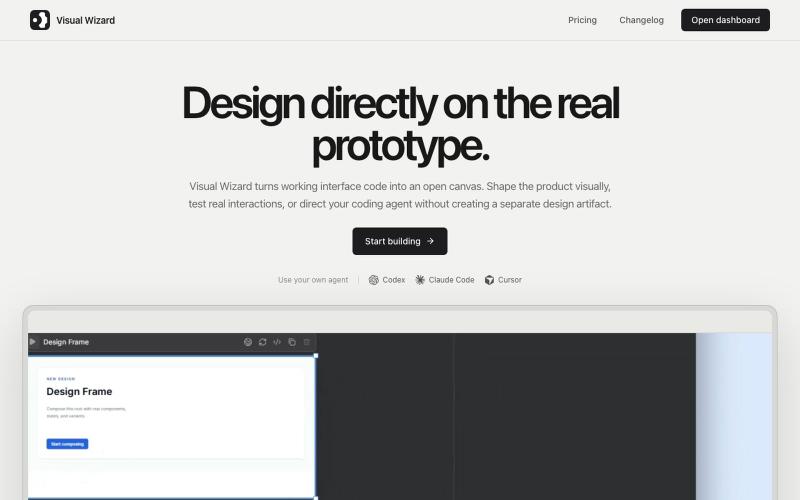
Visual Wizard 是一个视觉工作空间,与编程AI代理实时设计工作原型。
u/tokmako · Reddit
I am developing an alternative work environment to Claude Design. When I first tried Claude Design, I really liked the idea. But after generating a design, I kept wanting a more direct way to continue working on it not as a separate design representation, but as a live, working interface. That’s what I’m building with VisualWizard. The canvas contains real, interactive prototypes. You can select elements directly, move or resize them, change styles, and keep interactions and
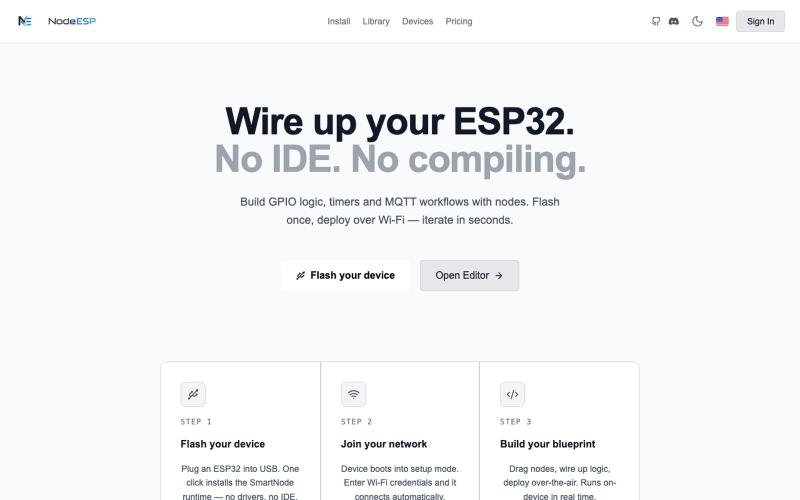
NodeESP是ESP32的可视化编程工具,通过节点拖拽创建GPIO逻辑和MQTT工作流。

@NodeESP · X
- Project for sale
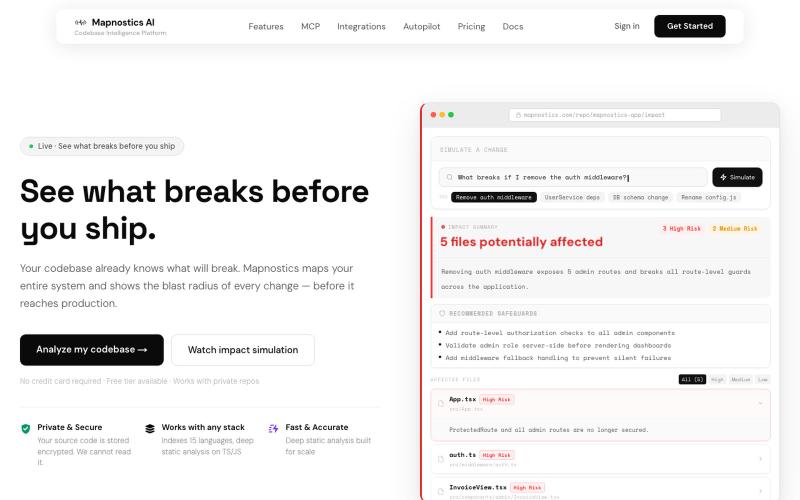
AI-powered tool that helps engineering teams understand, navigate, and modernize legacy codebases.

@ffteema · X
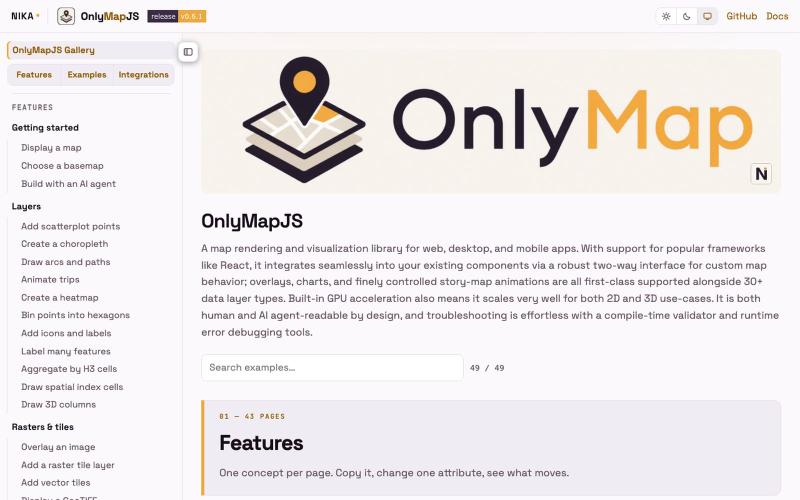
用OnlyMap构建具有30+个2D/3D图层和GPU加速的交互式Web和移动地图。

@lawrencenika · X
OnlyMap is being built fast, docs already live. New trailer walks through it end to end. It already works with your coding agent — hit "Copy for your agent" on any example, build in Claude Code, Codex, or Cursor.
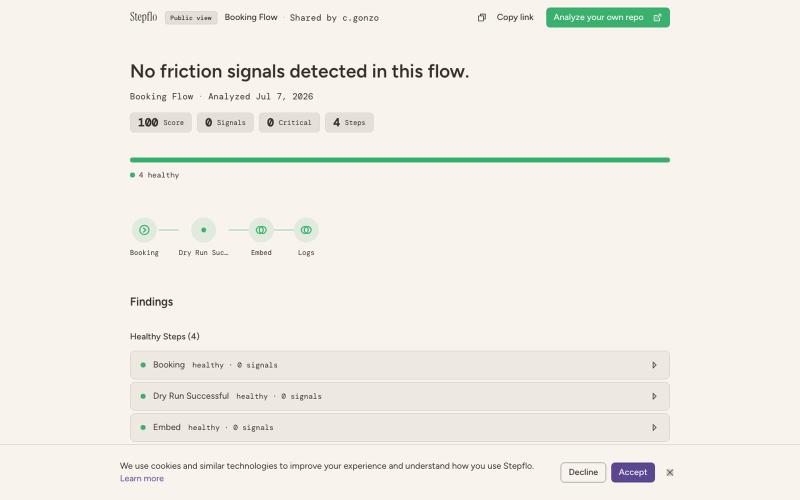
Stepflo 连接 GitHub 代码库,自动检测用户流并生成可视化地图。
u/freestyle_gonzo · Reddit
Vibe coding made building fast. It didn't make understanding easy. Something changed in the last year. Vibe coding (or agentic engineering if you ask some) made writing an app fast. Week-to-weekend fast. More people are building software than ever before, and I think that's a genuinely good thing. But fast building creates a new bottleneck. Writing code is no longer the hard part. Understanding what you built and its nuances is. A huge share of people shipping right now have never analyzed
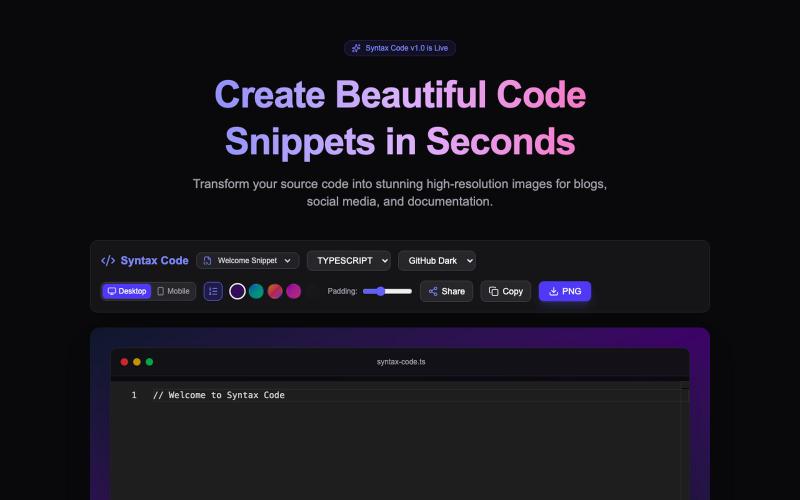
Free tool to transform your source code into stunning, high-resolution HD images. Customize themes, backgrounds, and export perfect code screenshots for Twitter/X, blogs, and docs.

@ricka_dev · X
Building Syntax Code 🚀 A free tool to turn raw source code into high-res, beautiful images for X, blogs, and docs.
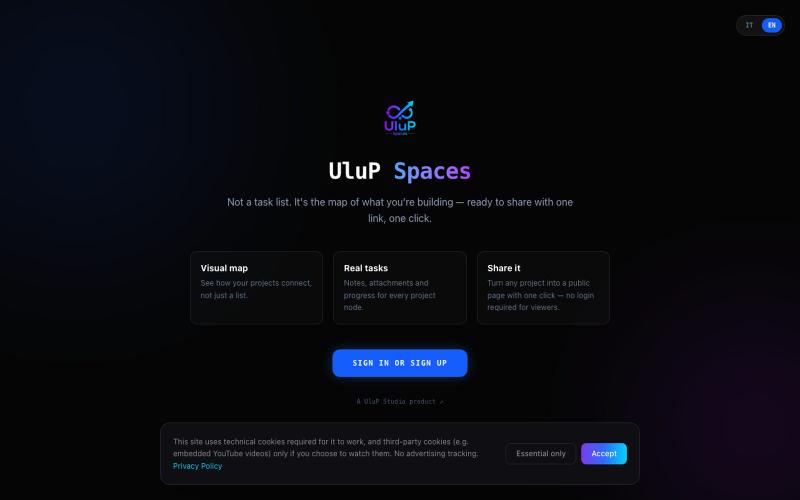
UluP Spaces is a visual project management tool where your work lives as a map of connected nodes instead of another endless list. Organize tasks, connect ideas, and collaborate wi

@UluPStudio · X
Visual projects, Focus Mode, Present Mode, collaboration, UluP Share, community templates — and native MCP support for Claude.
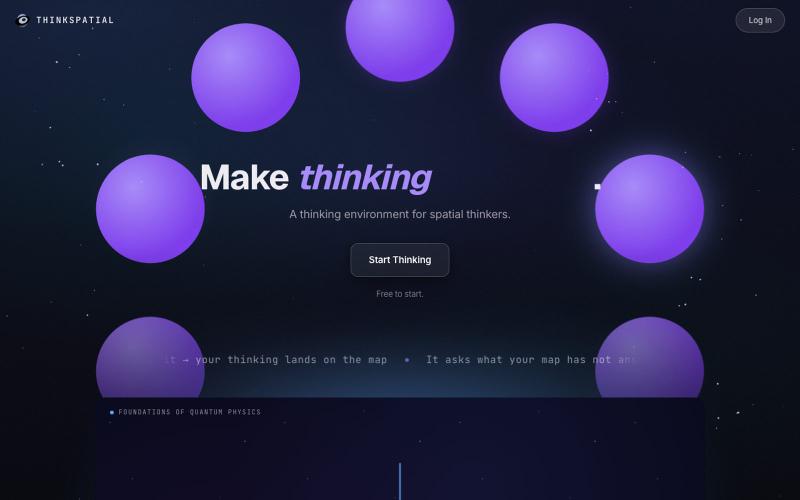
将想法组织为视觉地图,提取关键见解并转化为文档和演讲稿。
u/shadowosa1 · Reddit
I rebuilt my landing page after 300+ visitors still didn’t understand what my app does. I’ve been building a spatial thinking environment called ThinkSpatial, and one of the hardest parts hasn’t been building the product. It’s been explaining what it is in the first few seconds. The basic idea is simple. You speak or type, and your thinking gets turned into a visual map instead of disappearing into a chat box, doc, or note-taking app. My first landing page was way too focused on showing h
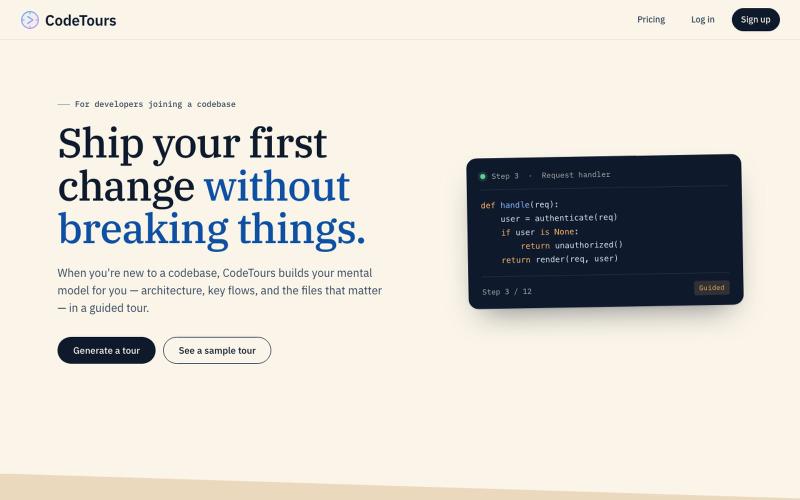
CodeTours 生成 AI 导览帮助理解代码库架构、入口和扩展步骤。
u/dogballer05 · Reddit
I want to be brutally honest - my team and I built an AI code repo analyzer and we are having trouble getting even our friends and family to use it Looking for helpful feedback on where are we going wrong - we have pitched to companies and individuals and everyone we talk to says that keeping up with and understanding code bases is getting harder and harder as AI moves things so quickly but we are not seeing users even try it out on free accounts. Here is our URL: https://codetours.ai/
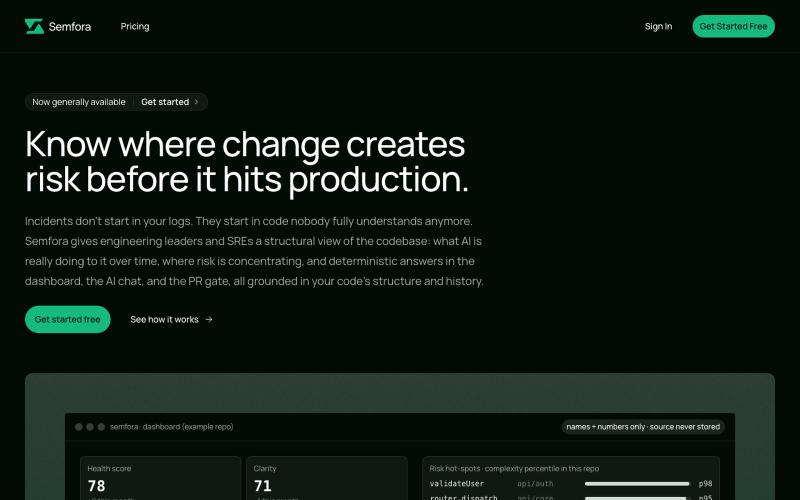
Semfora: 分析代码库结构找出代码变更的风险
u/jeremyStover · Reddit
My second paying customer bought a full year subscription. I have mentioned https://semfora.ai before, here and there on Reddit. I haven't talked much about what it really provides. I was hoping to drive up some organic traffic, from people that had the motivation to dig past the beta. Stupid idea, but now that we have passed pen tests and hit the minimum requirements check list for security audits, (see other threads about that) we opened up the beta to everyone. Two days after that(