
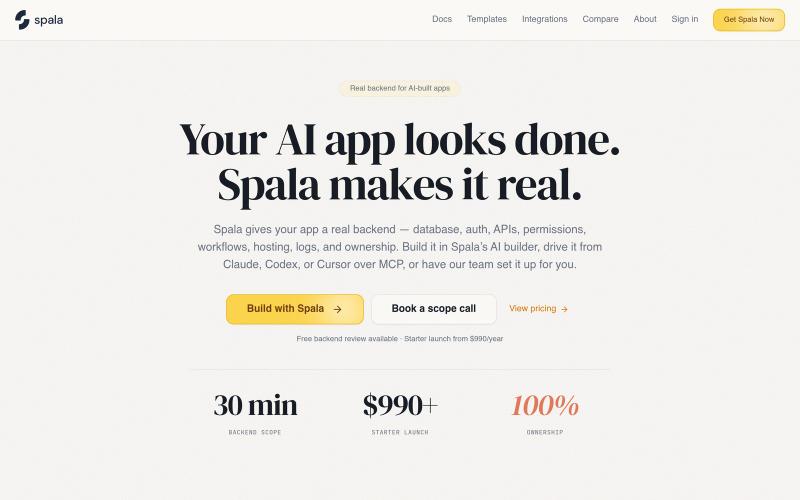
完整作品展
技术栈
60 projects
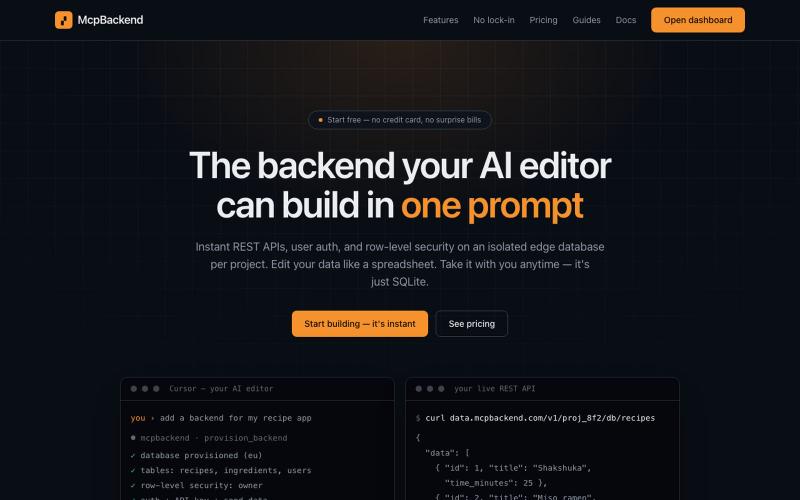
为AI应用提供MCP服务器、REST API和行级安全的后端服务平台。
u/bob__io · Reddit
What we learned from trying to turn vibe-coded prototypes into production SaaS applications Founder here. While developing MCPBackend, we noticed a major difference between generating a convincing application demo and building a maintainable SaaS product. AI coding tools are increasingly capable of generating interfaces, routes and even initial application logic. But a production application still needs: a reliable data model authentication and authorization backend validation
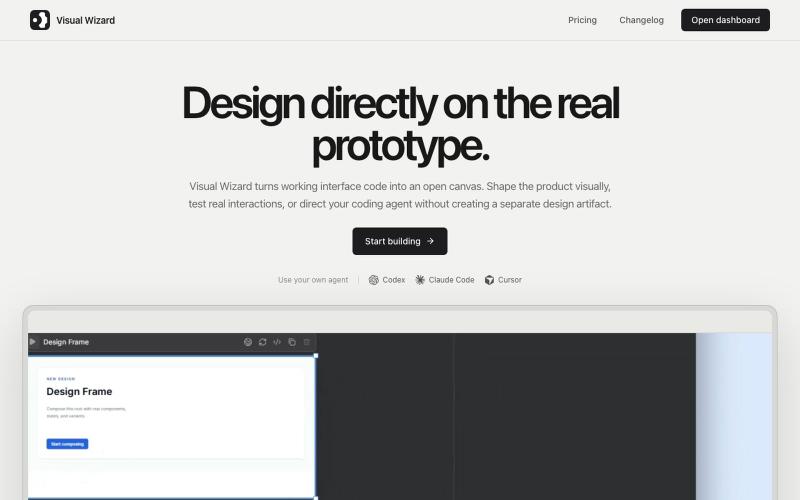
Visual Wizard 是一个视觉工作空间,与编程AI代理实时设计工作原型。
u/tokmako · Reddit
I am developing an alternative work environment to Claude Design. When I first tried Claude Design, I really liked the idea. But after generating a design, I kept wanting a more direct way to continue working on it not as a separate design representation, but as a live, working interface. That’s what I’m building with VisualWizard. The canvas contains real, interactive prototypes. You can select elements directly, move or resize them, change styles, and keep interactions and
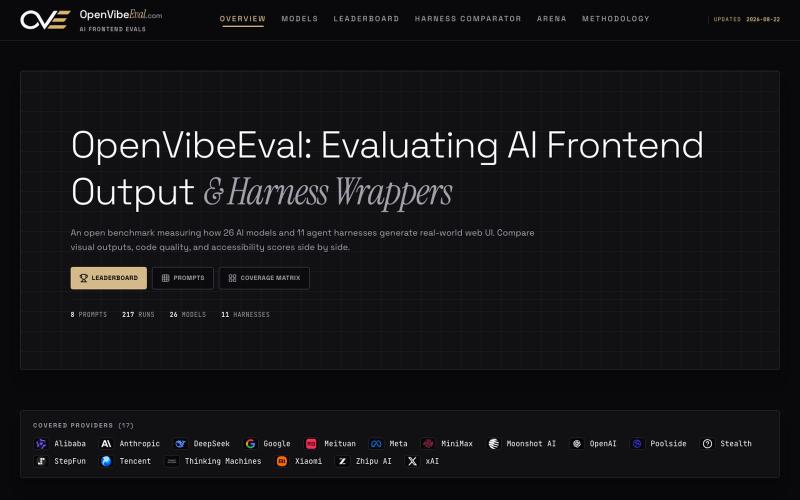
在OpenVibeEval中对比不同AI模型生成前端代码和可访问性评分。
u/12qwww · Reddit
I built a live benchmark to see which AI actually writes the best frontend code Hey everyone! I built OpenVibeEval because I was tired of "vibe-checking" AI-generated frontend code. I wanted to know which model actually produces the most accessible and clean React/Tailwind output. What I built: •A leaderboard of 24 models (Claude, GPT, DeepSeek, etc.) ranked by axe-core accessibility scores. •A Harness Comparator to show how different system prompts change the same model's output. •
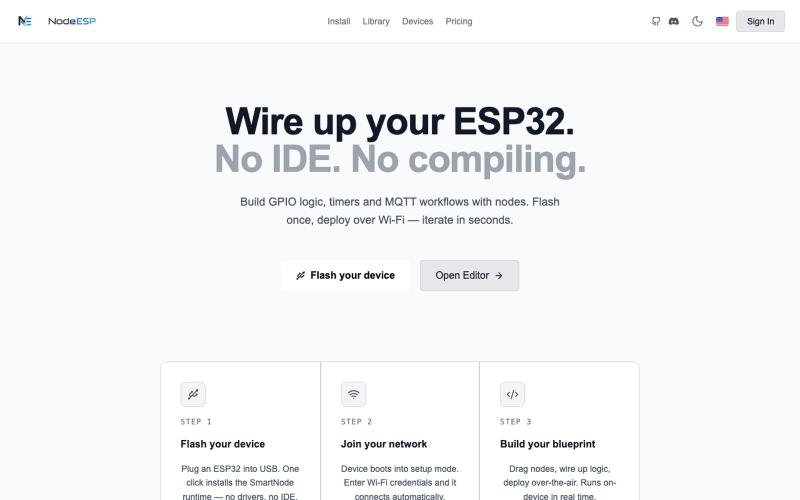
NodeESP是ESP32的可视化编程工具,通过节点拖拽创建GPIO逻辑和MQTT工作流。

@NodeESP · X
- Project for sale
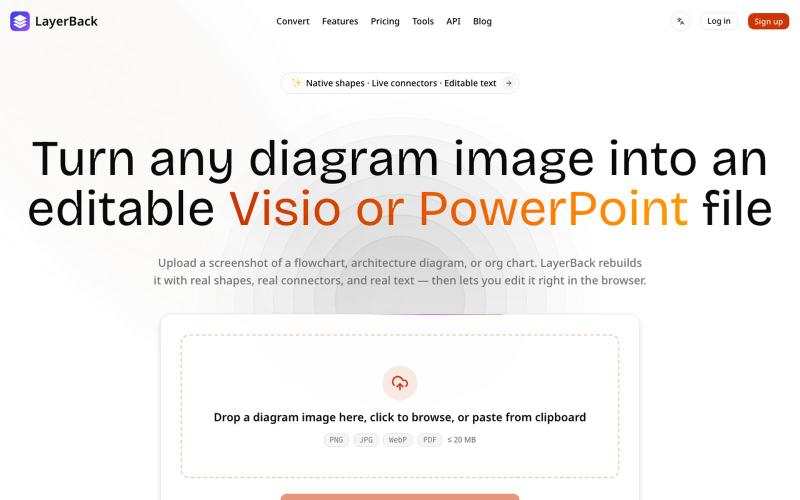
将图表图像转换为可编辑的 Visio、PowerPoint 和 draw.io 文件。

@ChenDavie_AI · X
Just shipped a new LayerBack update 🚀 Turn screenshots, photos, and diagram images into editable Visio or PowerPoint files — directly in the browser or via API. Image in. Editable files out. #buildinpublic #AI #SaaS
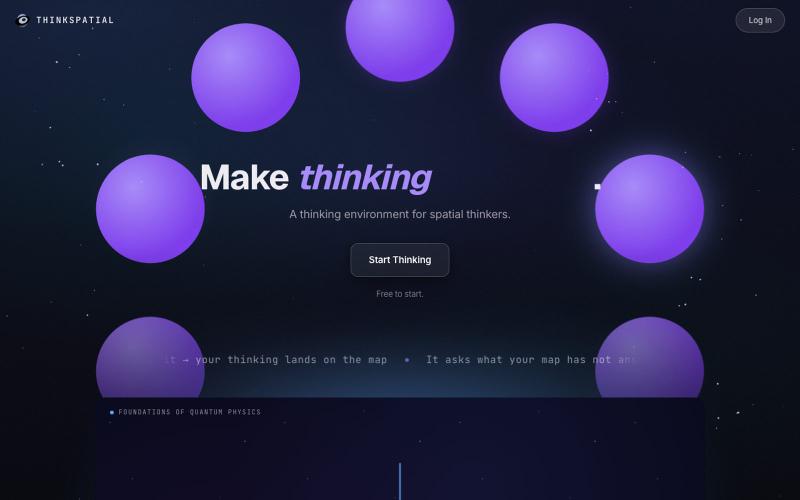
将想法组织为视觉地图,提取关键见解并转化为文档和演讲稿。
u/shadowosa1 · Reddit
I rebuilt my landing page after 300+ visitors still didn’t understand what my app does. I’ve been building a spatial thinking environment called ThinkSpatial, and one of the hardest parts hasn’t been building the product. It’s been explaining what it is in the first few seconds. The basic idea is simple. You speak or type, and your thinking gets turned into a visual map instead of disappearing into a chat box, doc, or note-taking app. My first landing page was way too focused on showing h
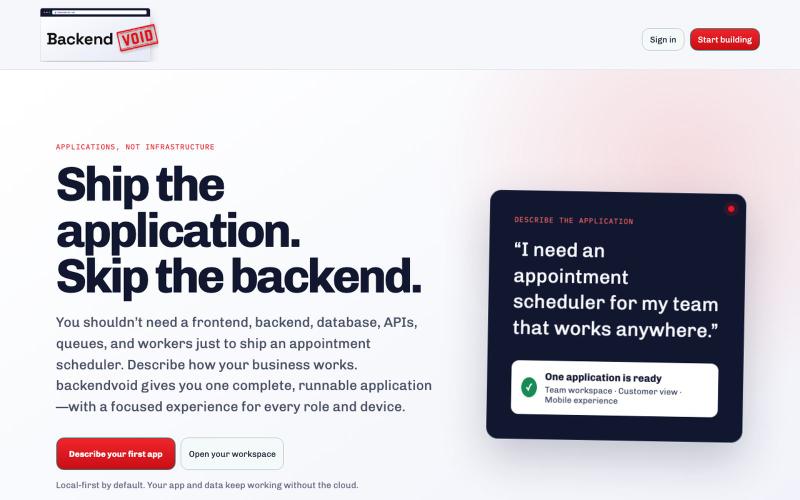
backendvoid 将业务流程转化为便携式应用供团队使用。

@facinatedbytech · X
Business applications, multiple projections, with optional backend.

Flint是为AI代理设计的可视化语言,用于创建交互式数据可视化。
chenglong-hn · HN
Data visualizations are the bridge between user and data. But building AI agents that can generate visualizations reliably can be very tricky: - simple chart specs can be reliable, but generated charts are often of low quality due to reliance on system defaults; - complex chart specs with explicit details can produce good-looking charts, but they are verbose and agents can struggle with reliability We figured out it is a limitation on the language issue (not just AI capability thing) -- current visualization languages are a bit too low-level for AI agents, requiring them to explicitly make visual decisions that are supposed to be handled by a good compiler. Flint is a visualization intermediate language to address this issue, allow AI agents to solve this last-mile human-agent interaction problem. It provides a simple semantic-type based specification, and contains a layout optimization engine that can produce good-looking charts (filled with derived low-level details) from simple
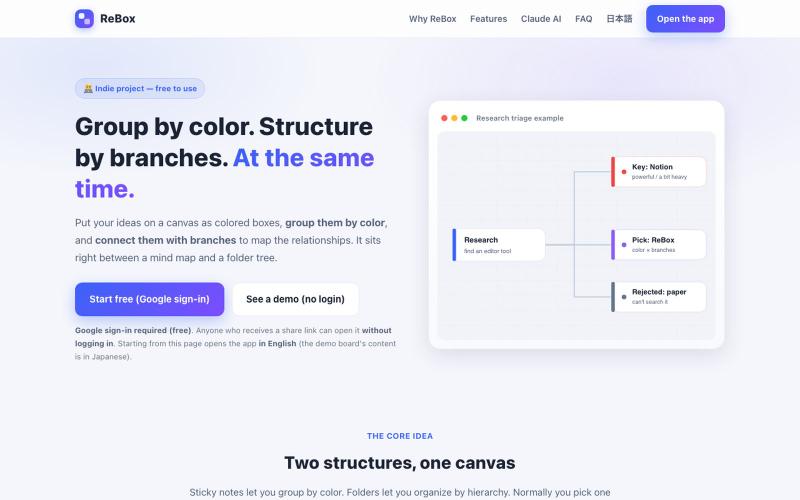
创建用颜色分组和分支结构的视觉看板,支持无需登录分享。

@shiftibis · X
Indie project 📝 ReBox: visual boards where color = group and branches = a file tree — both at once. Share links open without login (anyone with the link can edit). A Claude connector builds boards for you. English UI just shipped. #buildinpublic
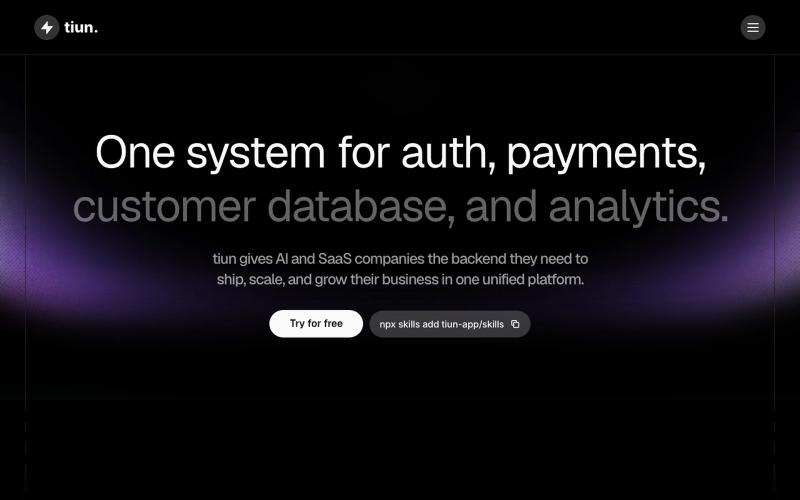
统一后端平台,为 SaaS 和 AI 公司提供身份验证、支付、客户数据库和分析。

@NikChr1414 · X

