Pickle Charts - Professional Multi-Chain Crypto Analytics & Portfolio Tracker
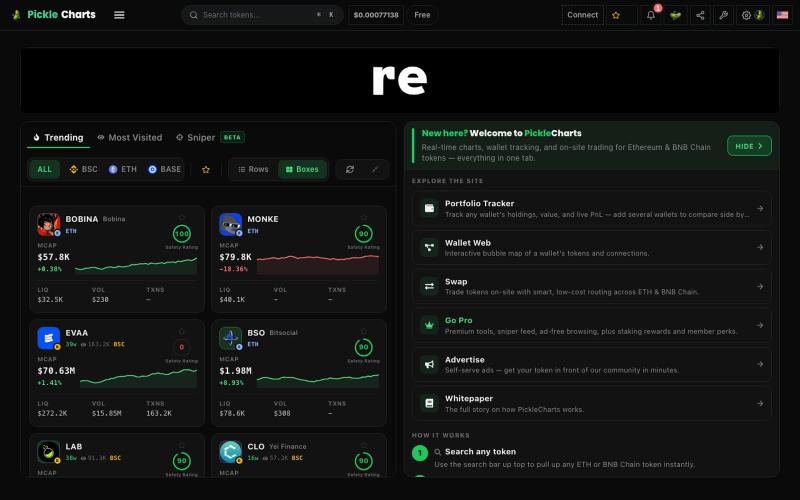
Pickle Charts 是一个多链加密分析平台,提供实时图表和投资组合追踪。
@PickleCharts · X
Hey @Shakib2O1 Would love to talk to you about my SaaS project ! Drop me a DM
完整作品展
技术栈
60 projects

Pickle Charts 是一个多链加密分析平台,提供实时图表和投资组合追踪。
@PickleCharts · X
Hey @Shakib2O1 Would love to talk to you about my SaaS project ! Drop me a DM

Flint是为AI代理设计的可视化语言,用于创建交互式数据可视化。
chenglong-hn · HN
Data visualizations are the bridge between user and data. But building AI agents that can generate visualizations reliably can be very tricky: - simple chart specs can be reliable, but generated charts are often of low quality due to reliance on system defaults; - complex chart specs with explicit details can produce good-looking charts, but they are verbose and agents can struggle with reliability We figured out it is a limitation on the language issue (not just AI capability thing) -- current visualization languages are a bit too low-level for AI agents, requiring them to explicitly make visual decisions that are supposed to be handled by a good compiler. Flint is a visualization intermediate language to address this issue, allow AI agents to solve this last-mile human-agent interaction problem. It provides a simple semantic-type based specification, and contains a layout optimization engine that can produce good-looking charts (filled with derived low-level details) from simple

追踪全球私募市场的活跃投资者和实时交易流。
@abumukheimer · X
Find Active Investors for your startup @SheetVenture

上传图表截图获取AI技术分析,识别支撑位、阻力位、趋势和形态。
@sreebuildss · X

创建品牌二维码,实时追踪扫描数据、设备和位置分析。
@codewithnovel · X
glad to know how much relevant my SaaS currently !

追踪并浏览 f(x) Protocol 和 fxUSD 的 on-chain data
@0xDrVV

创建流程图、程序图、组织架构和UML图的免费在线工具。
@N0V4Dev · X
I found a tool called Next AI that links AI capabilities directly with diagrams. It lets you build and edit diagrams using natural language prompts instead of clicking around the canvas manually. It's a handy way to sketch out architecture when you don't want to drag every box yourself. The project is built on TypeScript with React 19 and Next.js. It supports multiple AI providers and even includes an MCP Server. This means you can use it with the Claude Code CLI to generate diagrams from your terminal. Deployment options are flexible too. You can run the tool locally with Docker or push it to Vercel and Cloudflare Workers. It supports multi provider setups so you can pick the backend that fits your workflow. #Nextjs #AI #Diagrams #TypeScript

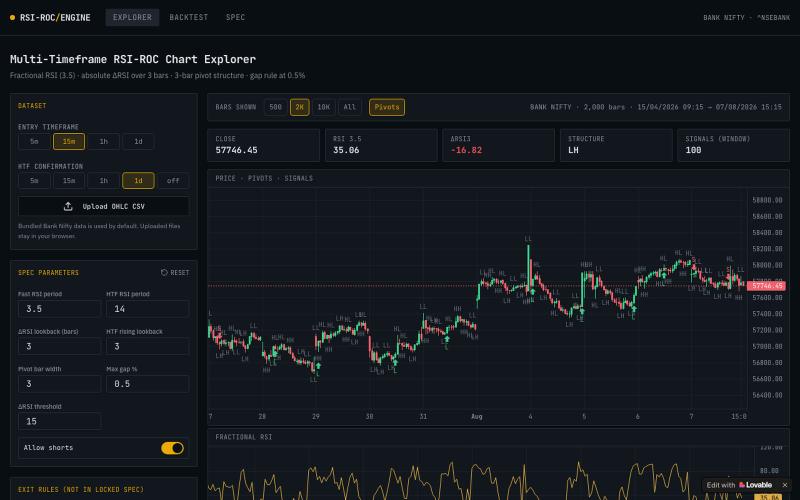
基于币安数据的加密货币缠论分析与交易信号平台。
@onehopeA9 · X
用 DAPPOS @dappOS_com 做了一个加密货币缠论分析网站,也是我一直想做没时间做的! 来看看缠论三买的威力: 不是不会写代码。 我自己是程序员,真要硬写当然能写。 但问题是:没时间。🤡 做交易的人都懂,真正消耗人的不是“看一根 K 线”,而是把一堆信息拼起来: K 线结构。 缠论笔、中枢。 一买二买三买。 一卖二卖三卖。 资金费率。 持仓量变化。 成交量异动。 市场舆情。 这些模块涉及太多方面,写得出来,但太费时间。 所以我一直想做一个自己的交易雷达: 接币安历史数据。 用 TradingView 展示 K 线。 自动画缠论结构。 标注买卖点。 再把资金费率、持仓量、成交量和币安广场热度放进去。 想法很清楚。 但一直躺在 TODO 里。 最近用 xbubble 的 Coding 功能试了一下,直接把需求丢进去: “做一个加密货币缠论分析网站,接入币安一年历史数据,用 TradingView 展示 K 线,自动画笔、中枢、一买二买三买、一卖二卖三卖,增加异动分析和币安广场舆情热度。” 它真给我生成了一个能跑的原型。 这次最戳我的不是“AI 会写代码”。 而是 xBubble 把最消耗时间的工程杂活压短了。 以前我自己做: ❌ 搭项目结构 ❌ 爬数据源和图表库 ❌ 写 K 线处理 ❌ 写缠论结构识别 ❌ 做前端交互 ❌ 部署、改样式、修细节 一圈下来,核心想法还没验证,人先累了。 现在变成: ✅ 先描述业务目标 ✅ 让 xBubble 生成可运行原型 ✅ 我再校验规则、调整逻辑、优化体验 ✅ 把时间花在交易理解和产品迭代上 这对程序员其实很有价值。 因为程序员最缺的不是能力,而是时间和注意力。 我这个原型现在大概有几块: 第一,TradingView K 线主图。 用币安数据展示行情,再叠加缠论结构。 第二,笔和中枢。 把原本需要手动盯的结构,先自动画出来。 第三,买卖点雷达。 一买、二买、三买,一卖、二卖、三卖,先帮我筛可能的位置。 第四,异动面板。 资金费率、持仓量、成交量变化,和 K 线结构一起看。 第五,舆情热度。 把币安广场讨论热度也拉进来,看看市场情绪是不是和盘面互相印证。 你可以理解成: 我不是让 AI 替我交易。 我是让 AI 帮我做一个交易前的信息雷达。 我觉得 xBubble 和普通 AI

Smart Link:链接追踪平台,支持地理定位、机器人防护和A/B测试。
@smartlinkpro10 · X
Building Smart Link Marketing infrastructure for serious marketers. One platform replacing: → Link tracker → Bot protection → Geo targeting → A/B testing → Deep analytics

用 markdown 笔记组织想法,支持进度追踪,并将其可视化为交互式思维导图
@vasanthadabala · X
Not really a startup. It's just something I built for myself a simple note taking app with a planner, progress tracker, and mind map I'm going to share it publicly @NodesMap check it

聚合所有链接到一个页面,含二维码和实时统计
@interchained · X
one handle, every surface

上传数据集自动发现具有统计意义的相关性和因果关系。
@matthew_meadows · X
Correlation Studio - Discovery Mining • Causation Analysis A powerful new SaaS statistics application that brings the insights of correlation data science to everyone. Data science without the code.