
开发者工具1 month ago
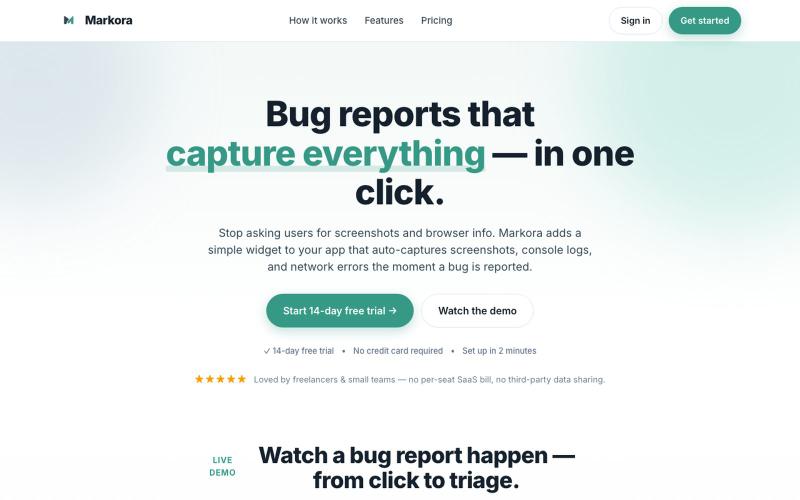
Markora — Visual Bug Reporting for Modern Teams
向应用添加小部件,自动捕获用户报告错误时的截图、控制台日志和网络错误。

@markoradotme · X
完整作品展
技术栈
60 projects
向应用添加小部件,自动捕获用户报告错误时的截图、控制台日志和网络错误。
@markoradotme · X
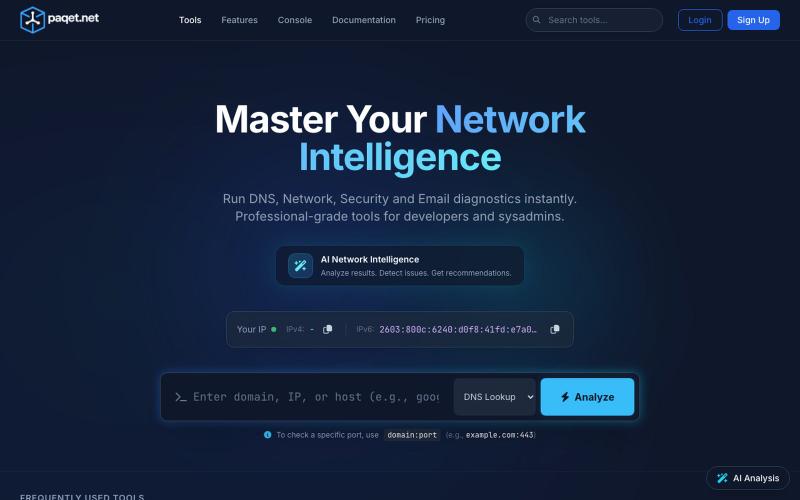
一站式AI网络诊断工具,支持DNS、SSL和数据包分析。

@paqetnet · X
Building Paqet — DNS, SSL, network & email diagnostics in one place, built to actually be usable. Describe your issue, AI runs the checks and tells you what's wrong + what to do next. Solo-built, free to try, API included 🛠️
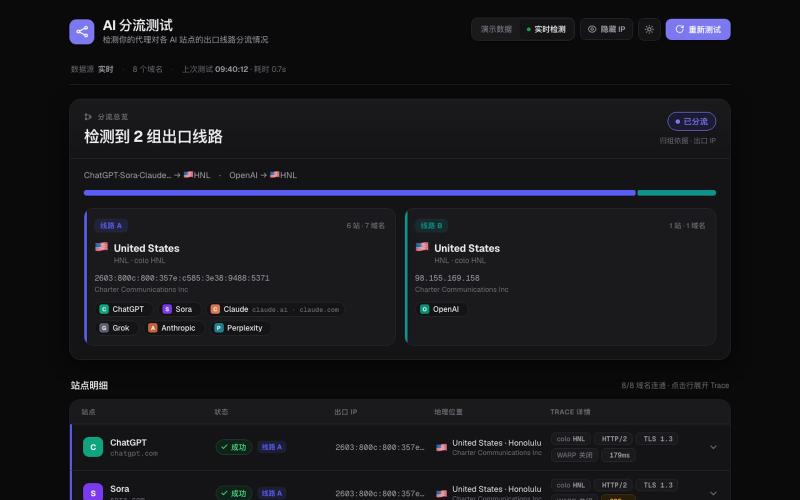
查看各 AI 服务使用的网络路由和 Cloudflare 节点。

@0xdeusyu · X
想知道代理是不是真的把每个 AI 站都送到同一个出口? 答案:并不是。 我做了一个 AI 分流测试: 它会探测 ChatGPT、Sora、OpenAI、Claude、Grok、Anthropic、Perplexity 等 AI 服务,通过读取各站点的 Cloudflare Edge Trace 信息,获取实际访问情况: 出口 IP Cloudflare 边缘节点(colo) HTTP / TLS / WARP 状态 访问延迟 然后根据落地位置进行归组。 这次测试结果: 6 个服务(覆盖 7 个域名)走美国出口。 唯一例外是 Sora,落在东京节点。 也就是说,同一个代理配置下,不同 AI 服务并不一定经过同一个出口。看起来“都能访问”,实际线路、节点和落地点可能完全不同。 整个测试工具纯前端实现,零后端。

检查 Cloudflare、Vercel 和 OpenAI 的实时故障状态,确定问题是否来自上游。
u/alex13h · Reddit
How do you determine if the problem is in your code or in your infrastructure? With the latest Cloudflare incident fresh in mind, I found myself wondering about the existence of a tool to help determine whether the bug is due to your own application or whether it is an upstream provider’s fault. That’s why I built the very basic prototype which aggregates incidents from popular providers, and attempts to extract affected regions, affected components, severity and timelines of
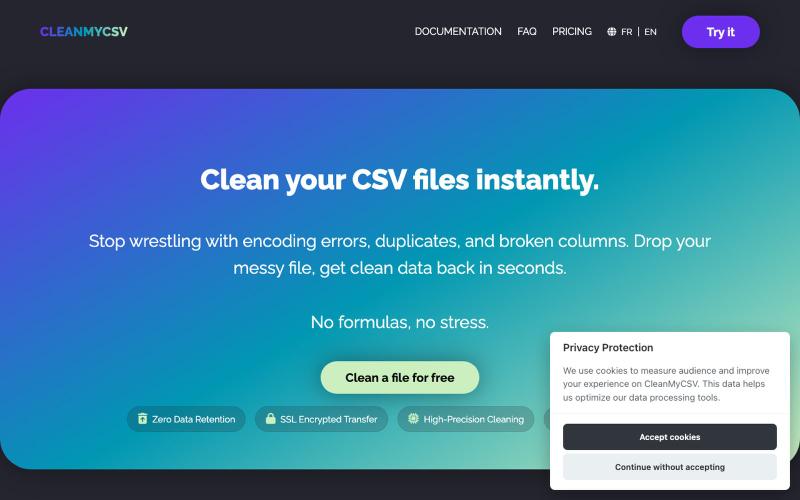
快速修复 CSV 格式问题、重复项和编码错误。

@cleanmycsv_app · X
hi alisha, just shipped to fix corrupted utf-8, missing zeros and bad formatting before importing to crms. building in public now 🚀 let’s connect!
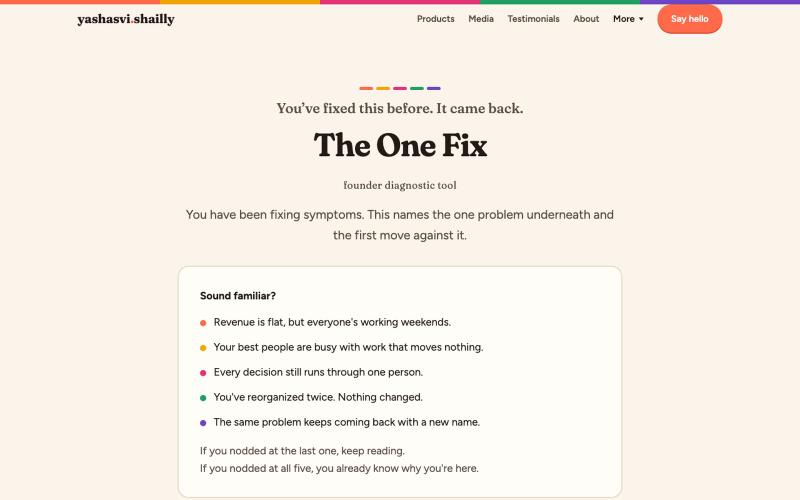
Ten recurring problems usually share one root. The One Fix names it: 3 minutes, one fix.

@yashasvishailly · X
Founders, find the one underlying pattern underlying all that noise
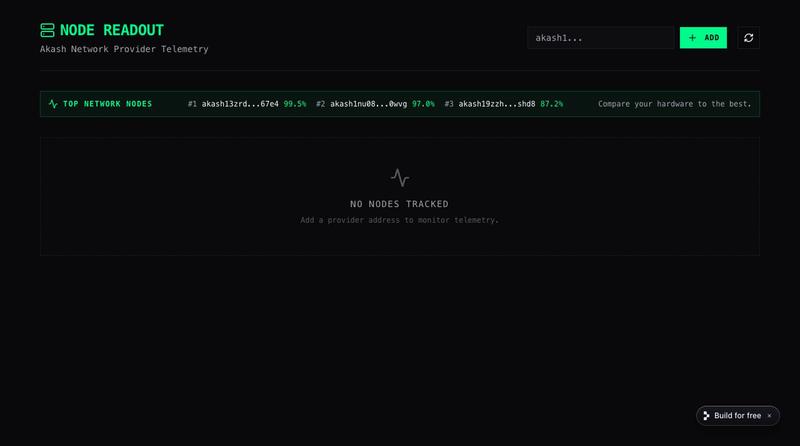
查看和读取 Akash Network 去中心化计算网络中的节点数据。

@ConnorBuil9kpt · X
Node Readout For Akash Network
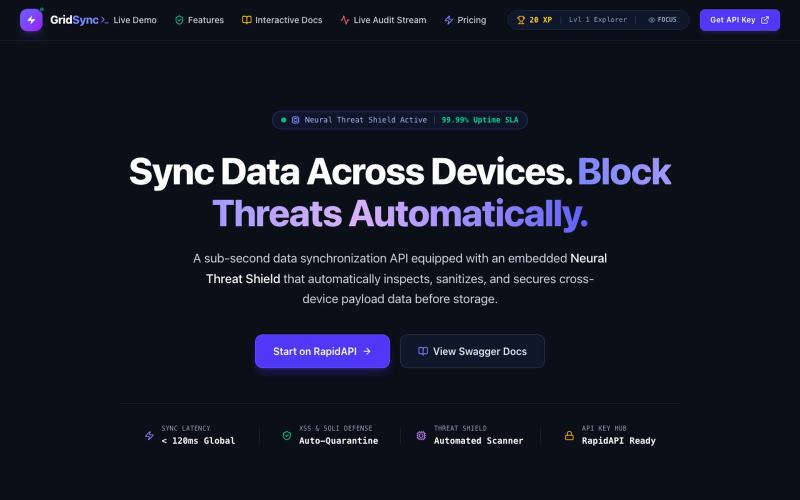
通过 GridSync API 实时同步跨设备数据,具有自动威胁检测和清理功能。

@mygridsyncdev · X
Just launched GridSync ⚡️ Sub-150ms zero-trust payload inspection & real-time sync for modern APIs. Try the free tier on RapidAPI or check out the docs: #buildinpublic #API #FastAPI
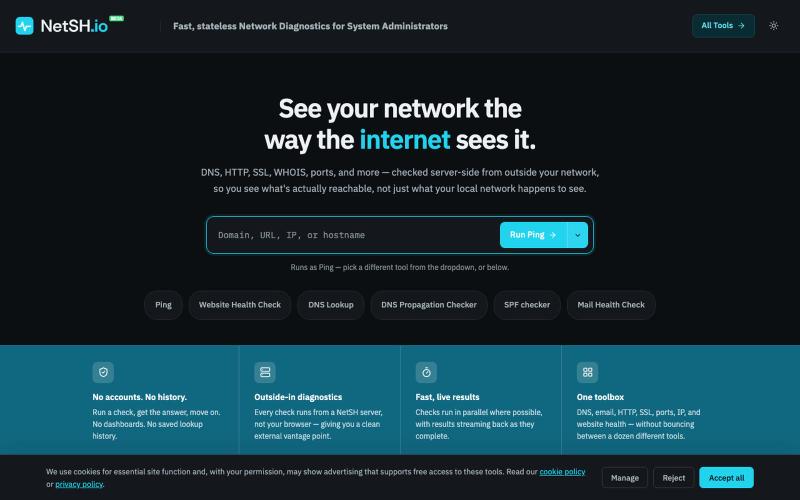
See your network the way the internet sees it. Ping, DNS, SSL, WHOIS, ports, and more — checked server-side, outside your network. No signup, no lookup history.

@Srikant_x64 · X
Here is mine
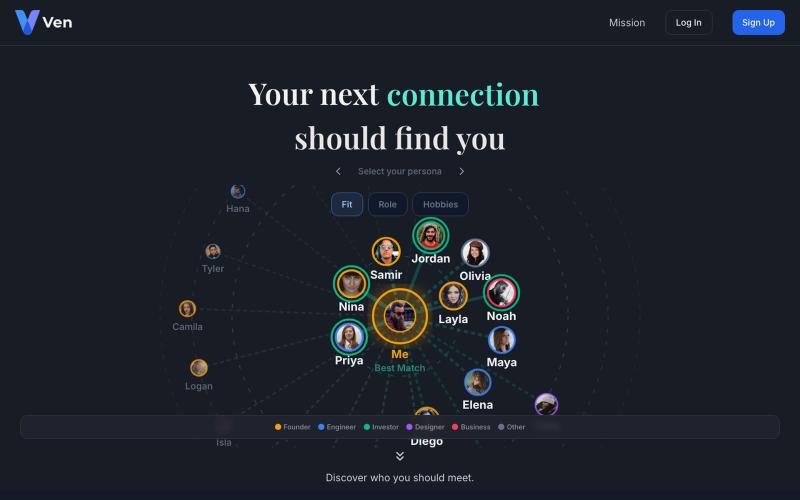
Ven — Intention-based networking for builders, founders, and innovators in San Diego and beyond.

@mmcgovern574 · X
LinkedIn that doesn’t gatekeep:
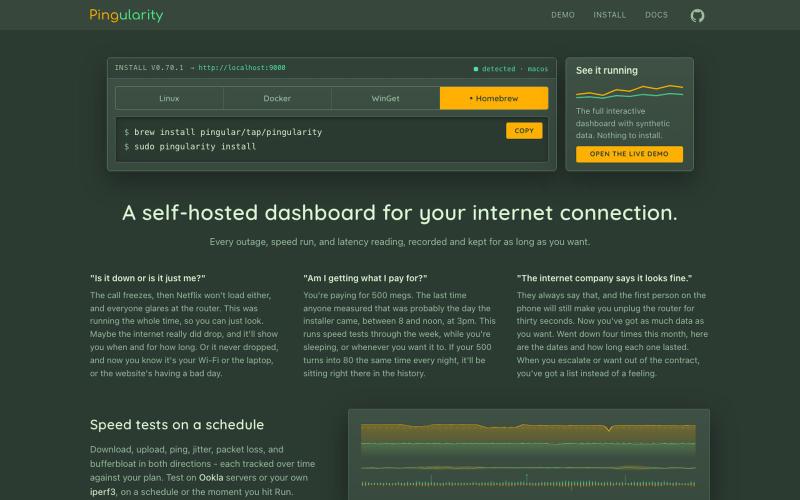
A self-hosted dashboard for your internet connection - monitor speed, latency, uptime, and outages on Linux, macOS, Windows, or Docker. One binary, zero telemetry.
cansofgrease · HN
Pingularity – scheduled Ookla/iperf3 speedtest dashboard, outage alerts
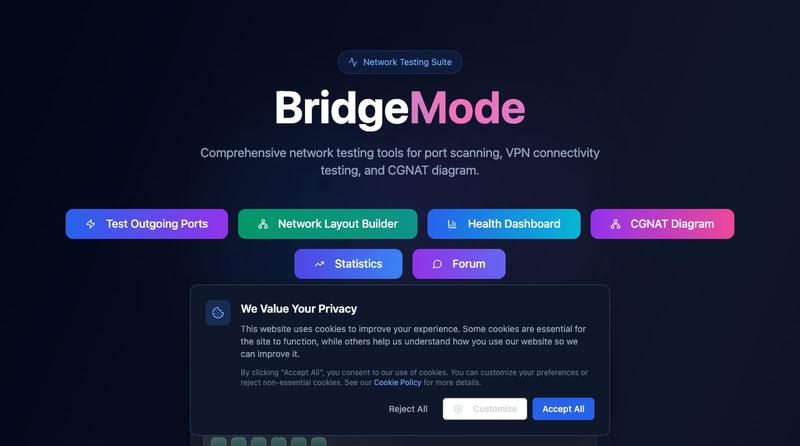
测试出站TCP端口,使用网络布局构建器创建并管理网络拓扑。
u/Legacy----one · Reddit
Network Layout Builder have a copy your topology and settings For the last 5 months I have been (directing with AI) making this Network Layout Builder you can try here https://bridgemode.network It seem this is not the only network topology out there but everyone has there own needs and thats what I have created so if you think this is the one great. The Network Layout Builder allows for level 3 switching router/firewall with everything you can mostly expect VLAN, firewall/ACL, Virtua