
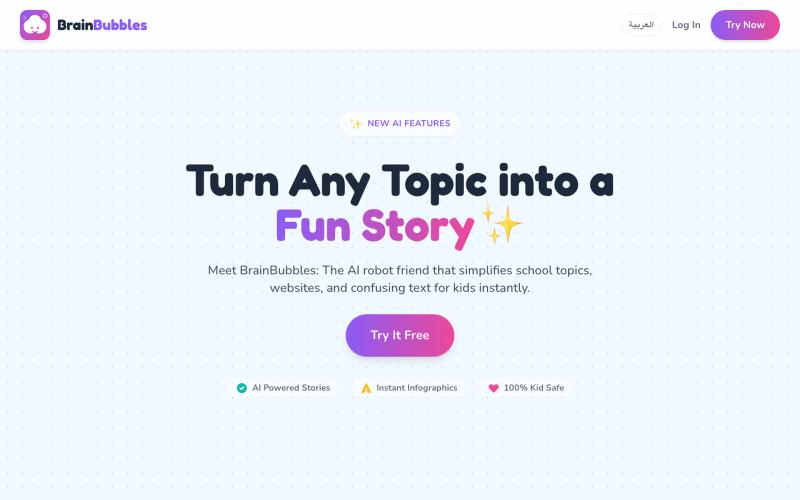
教育学习1 week ago
BrainBubbles - Learn anything in a snap!
BrainBubbles 将学校主题转化为儿童友好的故事和信息图表

@hazemnassr · X
完整作品展
技术栈
60 projects
BrainBubbles 将学校主题转化为儿童友好的故事和信息图表
@hazemnassr · X
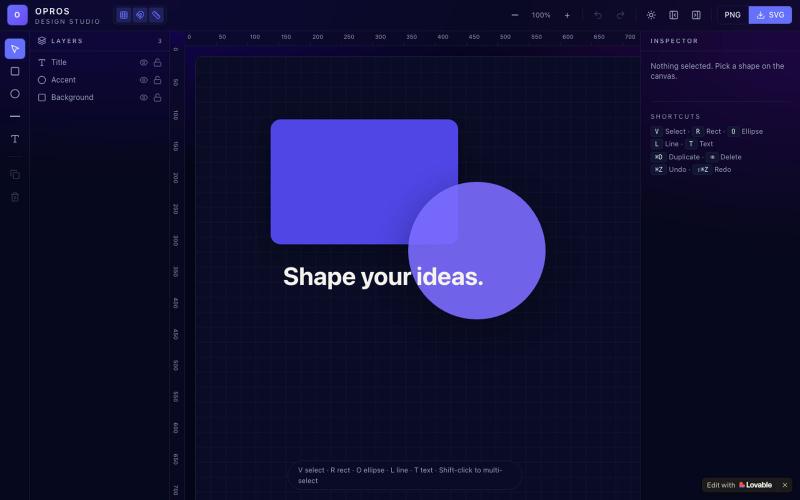
在网络上创建和可视化设计的创意工作室OPROS Design Studio。

@OprosOlamiflex · X
Check out what I just built with Lovable!
创建流程图、程序图、组织架构和UML图的免费在线工具。

@N0V4Dev · X
I found a tool called Next AI that links AI capabilities directly with diagrams. It lets you build and edit diagrams using natural language prompts instead of clicking around the canvas manually. It's a handy way to sketch out architecture when you don't want to drag every box yourself. The project is built on TypeScript with React 19 and Next.js. It supports multiple AI providers and even includes an MCP Server. This means you can use it with the Claude Code CLI to generate diagrams from your terminal. Deployment options are flexible too. You can run the tool locally with Docker or push it to Vercel and Cloudflare Workers. It supports multi provider setups so you can pick the backend that fits your workflow. #Nextjs #AI #Diagrams #TypeScript
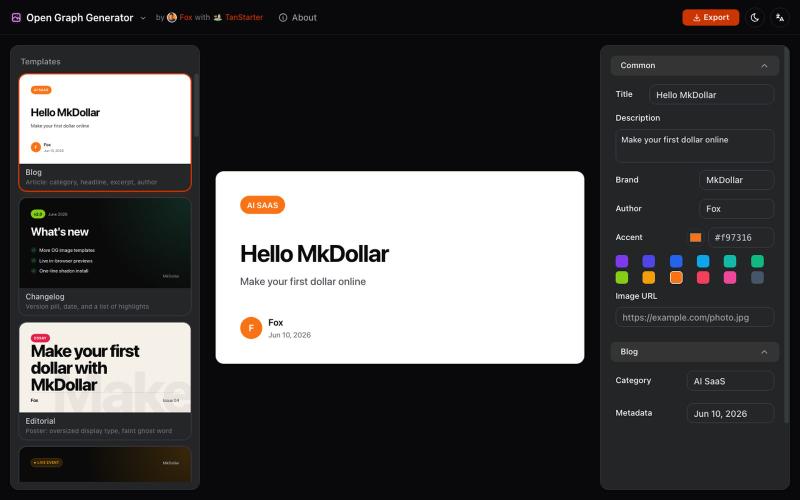
从模板生成可定制的 Open Graph 图片,用于博客和社交媒体。
javayhux · V2EX
名称:Open Graph 图片生成器 网址:[https://og.mkdollar.com]( https://og.mkdollar.com) 功能:内置 10+ Open Graph 图片模板,选择模板,配置参数,即可生成好看的 OG 图片,适用于文章配图、社媒帖 子封面等场景 价格:免费使用,免费下载 
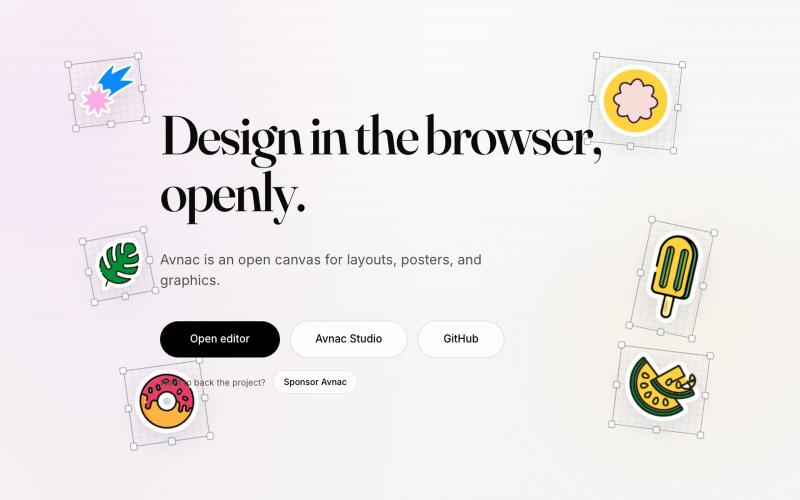
Avnac 是一个开源设计工具,可在浏览器中创建图形。

@akinkunmi · X
He trash-talked me and my amazing project ( unprovoked while all his projects are vibe-coded slop. That's why I named him King of Slop.
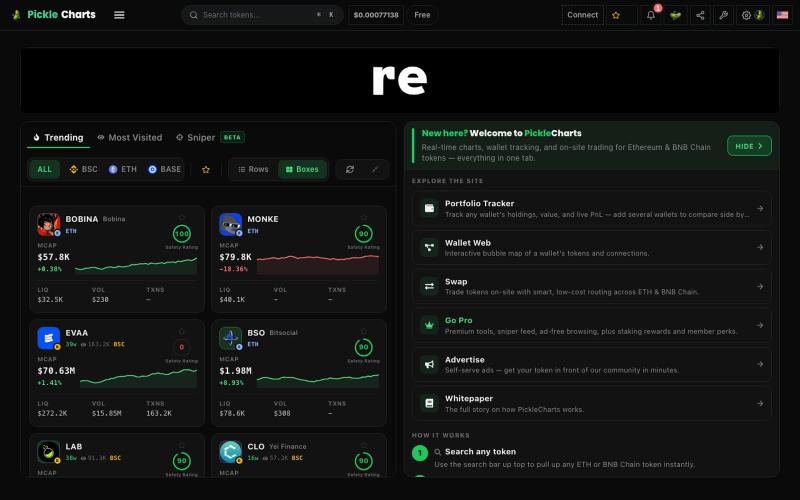
Pickle Charts 是一个多链加密分析平台,提供实时图表和投资组合追踪。

@PickleCharts · X
Hey @Shakib2O1 Would love to talk to you about my SaaS project ! Drop me a DM
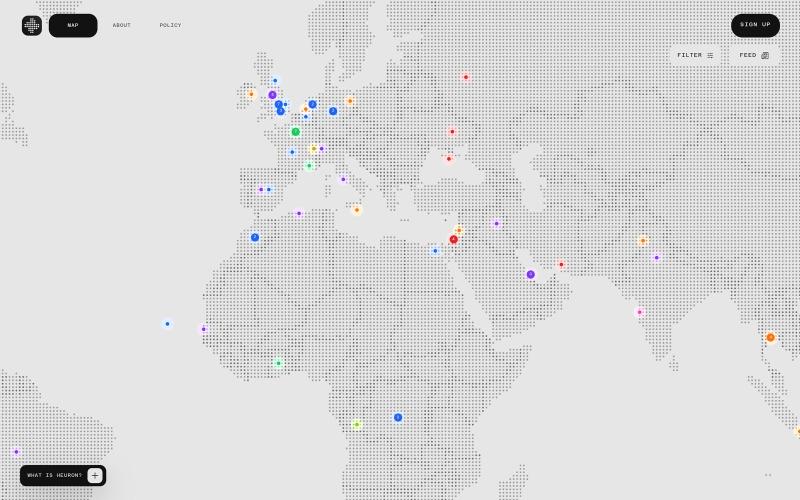
通过可视化、感知来源的新闻地图探索全球事件。

@brryg_ · X
sure man, working on a social and visual news hub called heuron - lmk what you think!
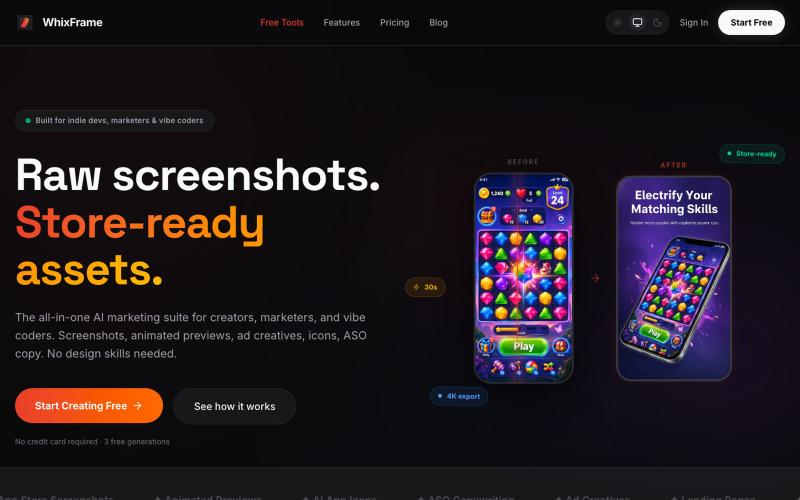
无需设计技能,用AI生成应用商店截图、图标和营销素材。

@Erdousky · X
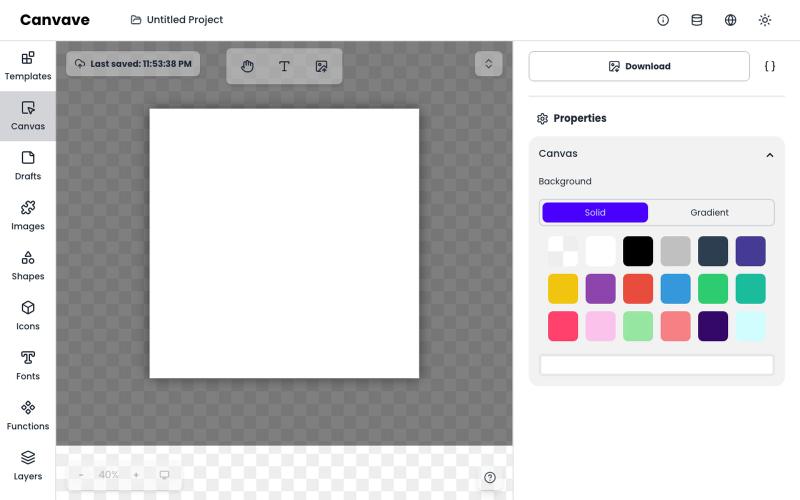
免费图形设计和动画工具,支持AI文生图和图生图功能。
Canvave — 简单图形设计和动画制作平台。无须专业技能也能做出任意尺寸的精美设计;最高支持图片 3x 或动画 240 FPS 导出;内置基于 Flux 的 AI 文生图、图生图;适合电商卖家、广告设计、社媒运营、独立开发等有设计需求的群体
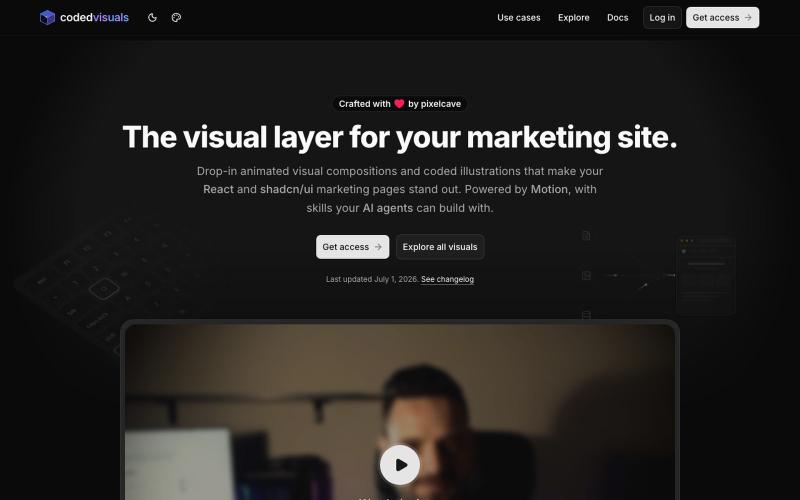
React 和 shadcn/ui components,用于在营销和登陆页面上创建 animated visual elements

@pixelcave_john · X
Hey Germán! I recently launched and a major update to Tailkit!

Flint是为AI代理设计的可视化语言,用于创建交互式数据可视化。
chenglong-hn · HN
Data visualizations are the bridge between user and data. But building AI agents that can generate visualizations reliably can be very tricky: - simple chart specs can be reliable, but generated charts are often of low quality due to reliance on system defaults; - complex chart specs with explicit details can produce good-looking charts, but they are verbose and agents can struggle with reliability We figured out it is a limitation on the language issue (not just AI capability thing) -- current visualization languages are a bit too low-level for AI agents, requiring them to explicitly make visual decisions that are supposed to be handled by a good compiler. Flint is a visualization intermediate language to address this issue, allow AI agents to solve this last-mile human-agent interaction problem. It provides a simple semantic-type based specification, and contains a layout optimization engine that can produce good-looking charts (filled with derived low-level details) from simple
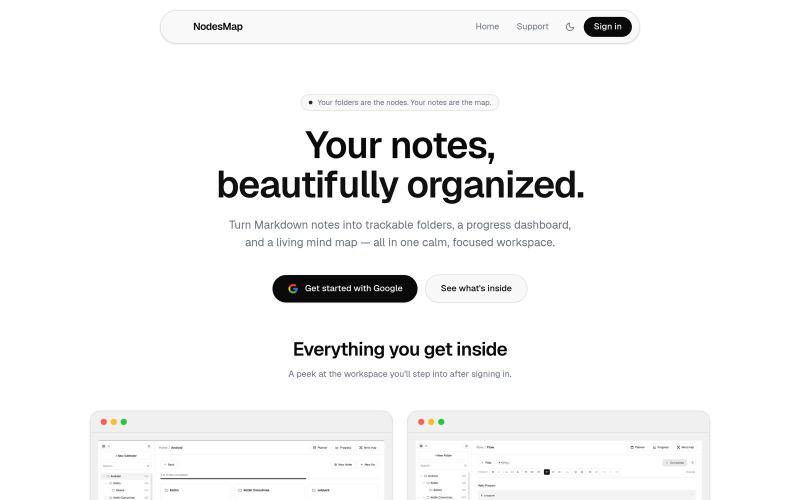
用 markdown 笔记组织想法,支持进度追踪,并将其可视化为交互式思维导图

@vasanthadabala · X
Not really a startup. It's just something I built for myself a simple note taking app with a planner, progress tracker, and mind map I'm going to share it publicly @NodesMap check it