
开发者工具1 month ago
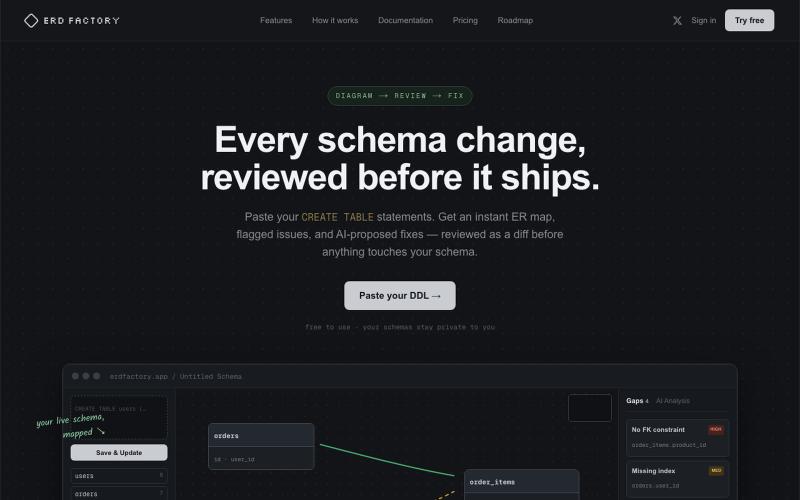
ERD Factory
将SQL架构可视化为ER图,审查AI建议的修复后再应用。

@erd_factory · X
Paste your CREATE TABLE statements. Get an instant ER map, flagged issues, and AI-proposed fixes — reviewed as a diff before anything touches your schema.
完整作品展
技术栈
60 projects
将SQL架构可视化为ER图,审查AI建议的修复后再应用。
@erd_factory · X
Paste your CREATE TABLE statements. Get an instant ER map, flagged issues, and AI-proposed fixes — reviewed as a diff before anything touches your schema.
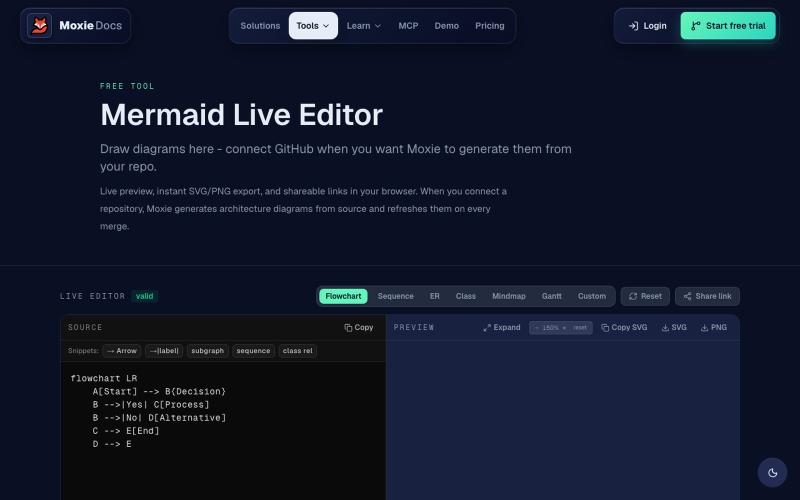
创建和导出 Mermaid 图表,包括流程图、ERD 和序列图
ghosts_ · HN
I've been slowly adding some new free tools to Moxie Docs (partly for SEO, partly to illustrate some of our feature sets before any commitment) for some reason this mermaid editor one blew up on Google rankings so I figured I'd share in case people find it useful! We also have ADR, AGENTS.md, LLMs, and a few other free tools.
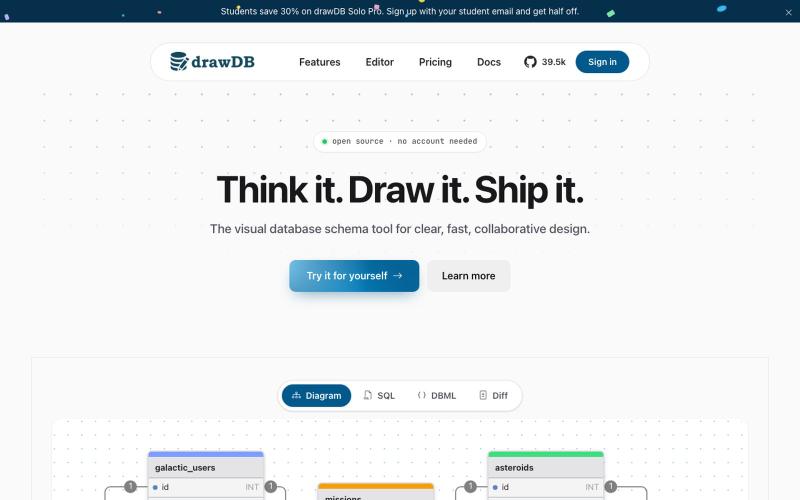
用 drawDB 设计数据库 ER 图并生成多种数据库的 SQL 代码。
1ilit · HN
DrawDB Pro – design database schemas for your team and agents
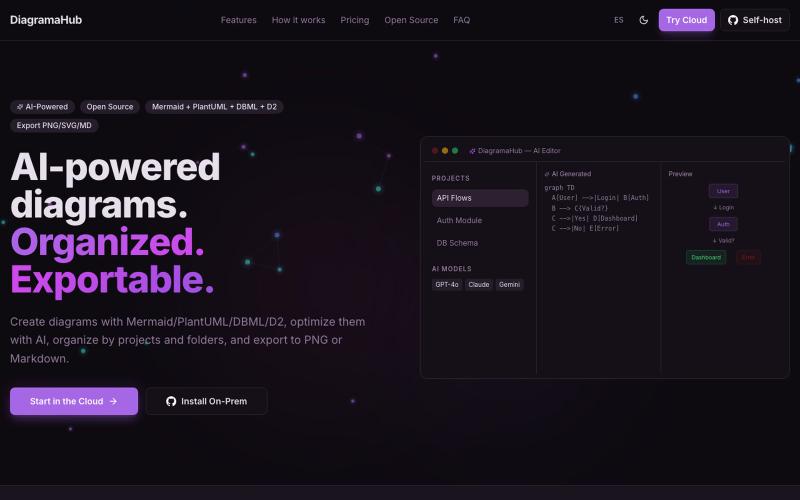
用文字创建和导出图表,支持 Mermaid、PlantUML、D2 等格式。

@soyalexdzul · X
Open-source platform for creating, organizing, and exporting diagrams using plain text markup. It combines the power of Mermaid, PlantUML, and D2 with a polished interface
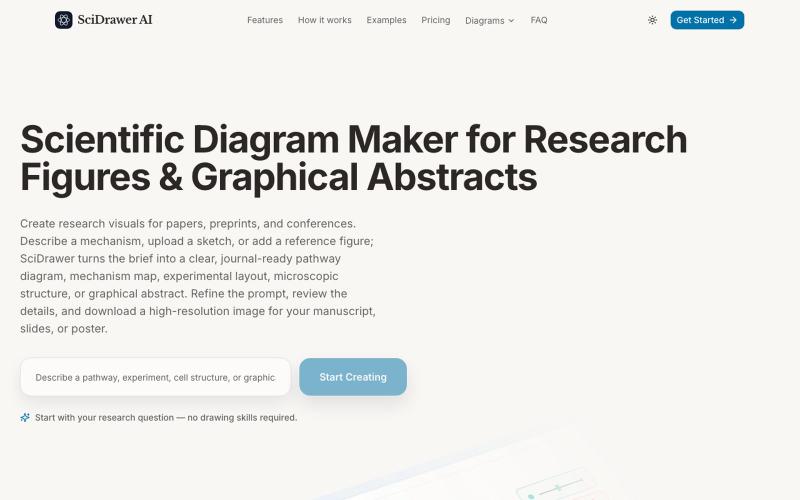
SciDrawer:从文字描述、手绘草图或参考图片生成科学研究图表。
zyrliuwei · V2EX
SciDrawer:基于人工智能的科学图表生成工具 SciDrawer 是一个专为科究人员设计的专业人工智能平台,可帮助他们即时生成符合期刊要求的图表、信号通路图和图形摘要。通过将文字描述、手绘草图或参考图片转换为高分辨率可视化内容,该平台消除了对复杂设计技能的需求,使科学家能够专注于研究本身,不需要手工绘图了。https://www.scidrawer.com
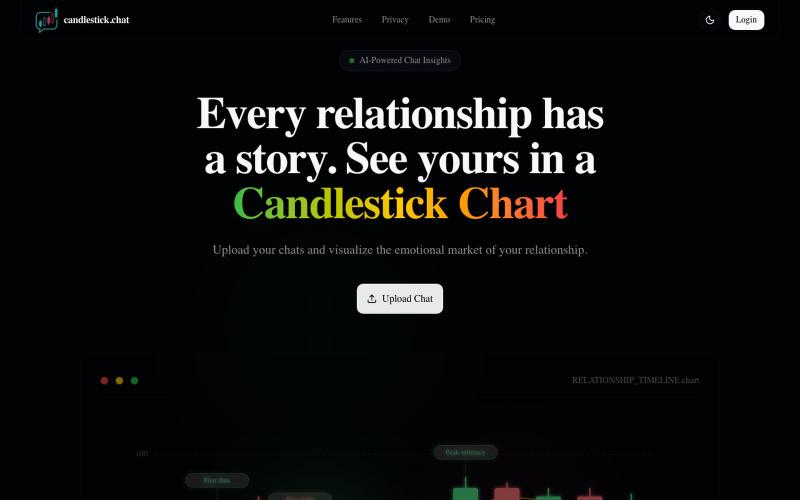
上传聊天记录,以烛台图表形式可视化你的关系情感趋势。

@Henry_Yangs · X
创建流程图、程序图、组织架构和UML图的免费在线工具。

@N0V4Dev · X
I found a tool called Next AI that links AI capabilities directly with diagrams. It lets you build and edit diagrams using natural language prompts instead of clicking around the canvas manually. It's a handy way to sketch out architecture when you don't want to drag every box yourself. The project is built on TypeScript with React 19 and Next.js. It supports multiple AI providers and even includes an MCP Server. This means you can use it with the Claude Code CLI to generate diagrams from your terminal. Deployment options are flexible too. You can run the tool locally with Docker or push it to Vercel and Cloudflare Workers. It supports multi provider setups so you can pick the backend that fits your workflow. #Nextjs #AI #Diagrams #TypeScript
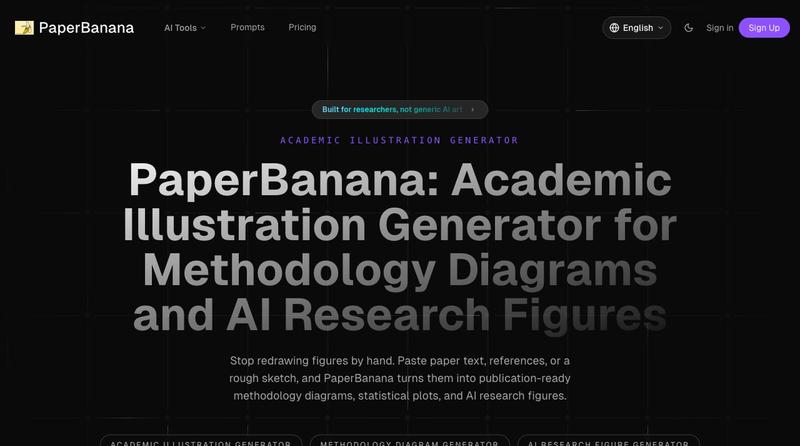
将学术论文和草图转化为发表就绪的研究图表。
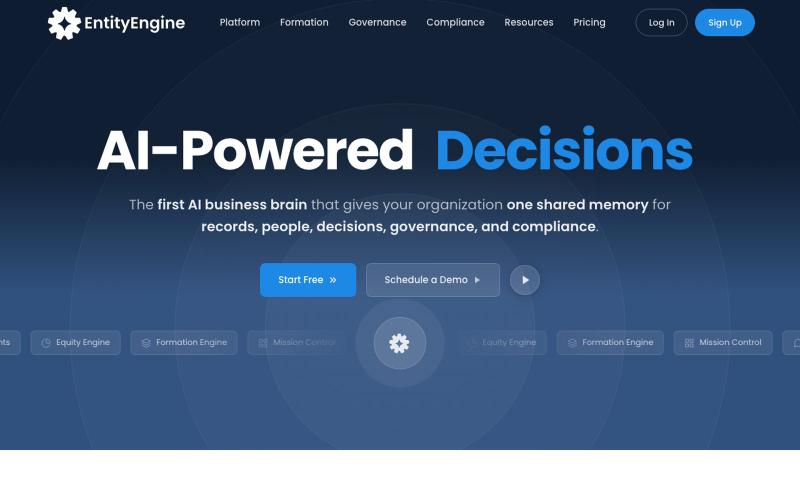
自动管理全球企业实体的成立、合规与治理。

@RealMikeBarrick · X
---- in Beta and FREE for a while!
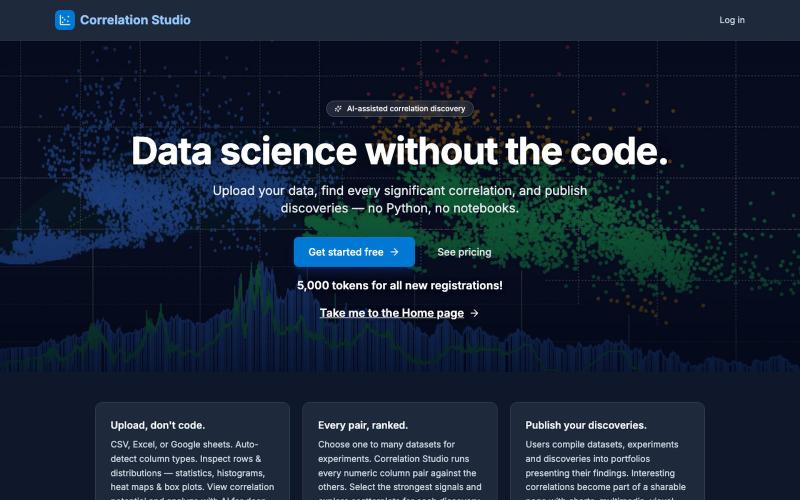
上传数据集自动发现具有统计意义的相关性和因果关系。

@matthew_meadows · X
Correlation Studio - Discovery Mining • Causation Analysis A powerful new SaaS statistics application that brings the insights of correlation data science to everyone. Data science without the code.
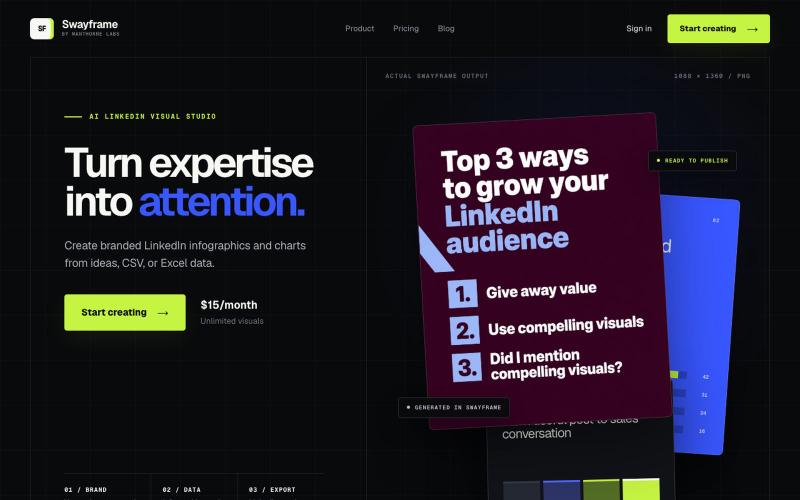
从想法、CSV或Excel数据生成LinkedIn信息图和图表。

@manthornelabs · X
We make LinkedIn graphics for B2B founders

Flint是为AI代理设计的可视化语言,用于创建交互式数据可视化。
chenglong-hn · HN
Data visualizations are the bridge between user and data. But building AI agents that can generate visualizations reliably can be very tricky: - simple chart specs can be reliable, but generated charts are often of low quality due to reliance on system defaults; - complex chart specs with explicit details can produce good-looking charts, but they are verbose and agents can struggle with reliability We figured out it is a limitation on the language issue (not just AI capability thing) -- current visualization languages are a bit too low-level for AI agents, requiring them to explicitly make visual decisions that are supposed to be handled by a good compiler. Flint is a visualization intermediate language to address this issue, allow AI agents to solve this last-mile human-agent interaction problem. It provides a simple semantic-type based specification, and contains a layout optimization engine that can produce good-looking charts (filled with derived low-level details) from simple