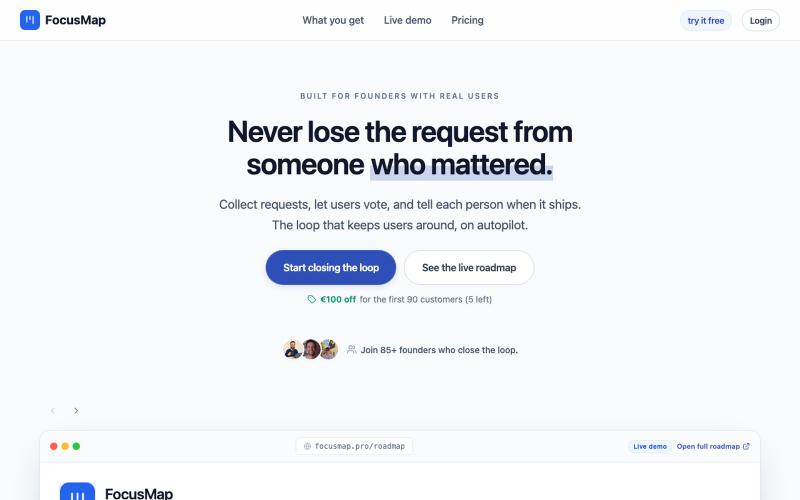
FocusMap | Public Roadmap and Feature Request Tool for Solo Founders
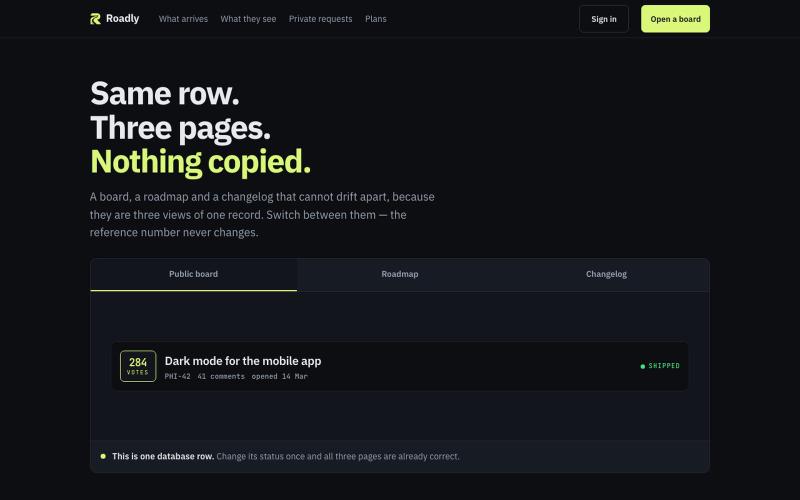
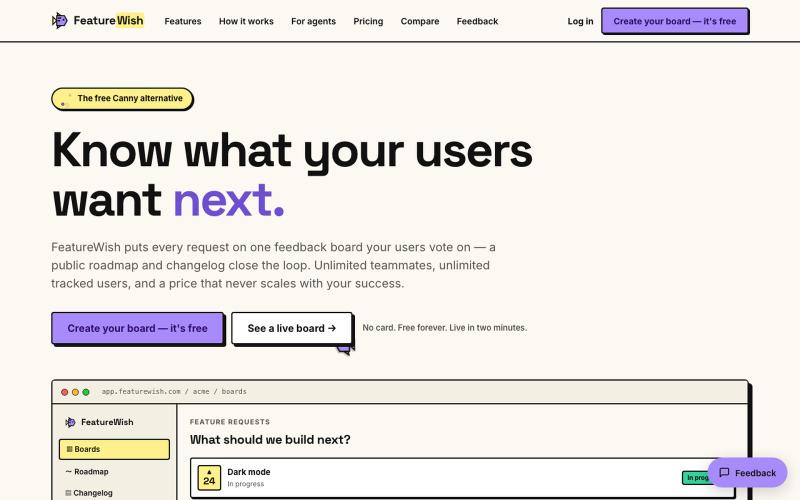
FocusMap帮助创始人收集用户反馈、展示产品路线图并自动通知用户进展。
@TimoBuilds_ · X
building up to leading SaaS for solo-founders to close the feedback-loop to their customers what are you building rn?
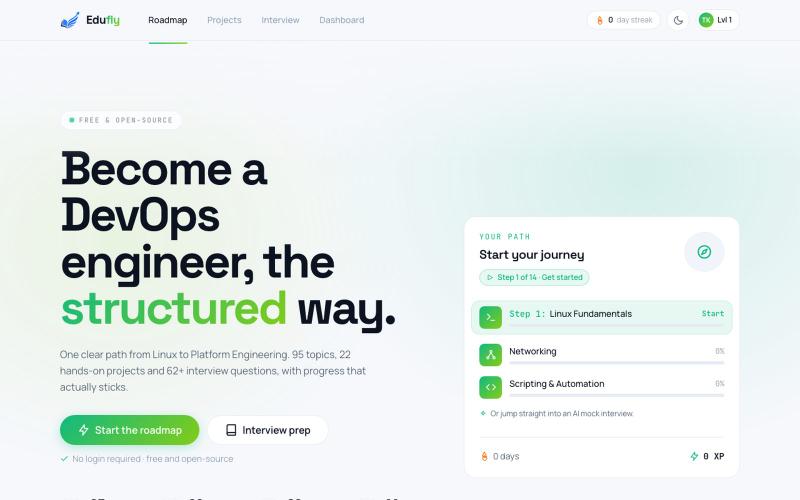
完整作品展
技术栈
60 projects

FocusMap帮助创始人收集用户反馈、展示产品路线图并自动通知用户进展。
@TimoBuilds_ · X
building up to leading SaaS for solo-founders to close the feedback-loop to their customers what are you building rn?


集中管理客户反馈,通过投票排序,并分享交互式产品路线图。
@himanshu_b20 · X


在工作空间中组织项目、任务和路线图,支持 AI 上下文导出。
@Fluxify_pro · X
everyone who sign up today, get free pro plan, without credit card

用 markdown 笔记组织想法,支持进度追踪,并将其可视化为交互式思维导图
@vasanthadabala · X
Not really a startup. It's just something I built for myself a simple note taking app with a planner, progress tracker, and mind map I'm going to share it publicly @NodesMap check it

上传PDF和视频创建视觉知识地图,使用AI研究助手进行对话。
allybahaei · HN
Bring all your sources into a visual space, ask questions with full context, branch LLM conversations, and go deep on YouTube videos / research papers to build your knowledge canvas.

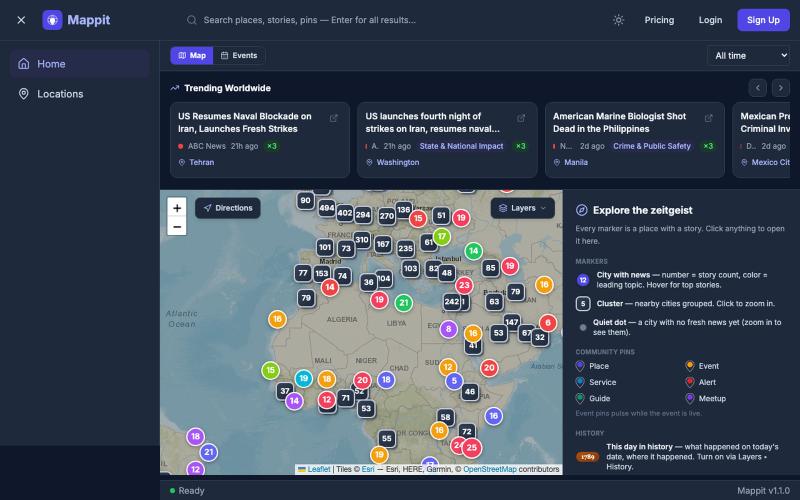
通过可视化、感知来源的新闻地图探索全球事件。
@brryg_ · X
sure man, working on a social and visual news hub called heuron - lmk what you think!

自动生成网站地图、Schema标记、元标签和robots.txt文件的AI工具。
@PeakVisibilitys · X
🚀 AI-powered SEO audits and AI search optimization. Would love some feedback!


可嵌入的可视化工作流编辑器,支持AI驱动或纯逻辑设计。
tahazsh · HN
Hi! I’m Taha. In many agentic products that support workflows (including one I worked on), I noticed they either don’t support node-based editors, or use React Flow and go through the difficult work of integrating it into their product to run it and work with their existing logic. So I thought about creating a tool that could help with this by closing the gap between the editor and the runtime. That’s why I created Wayflow. The basic architecture is simple: you just need to create a graph (which is a JSON object) that the runtime knows how to run. The runtime doesn’t care where that graph is coming from, it just needs the right schema. And with the help of the editor, you can create the graph, and then export it or directly save it on your backend in your database. And then when you want to execute it, you just hand it to the runtime. The runtime can either stream the execution (which is useful for the editor), or give you the final result. How you execute the graph is up to you: t

Komodo 为IT和MSP团队提供实时基础设施地图,整合任务、健康检查、文档和警报。
@JNRVInnovations · X