开发者工具2 days ago
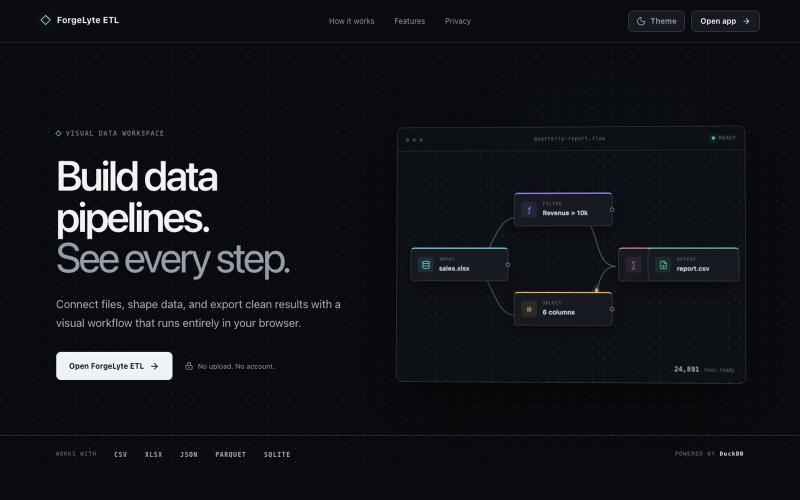
ForgeLyte ETL — Visual data pipelines in your browser
为 CSV、Excel、JSON 和 Parquet 文件创建可视化数据管道。

@ashkans_dev · X
An ETL tool:
完整作品展
技术栈
60 projects
为 CSV、Excel、JSON 和 Parquet 文件创建可视化数据管道。
@ashkans_dev · X
An ETL tool:

在浏览器中本地批量调整、裁剪、压缩和转换图像。

@MaximMitenkov · X
🔒 Just launched Image Pipeline — batch image processing in your browser. 100% private. No signup. Pay once, use forever. #buildinpublic #webdev #privacy

Flint是为AI代理设计的可视化语言,用于创建交互式数据可视化。
chenglong-hn · HN
Data visualizations are the bridge between user and data. But building AI agents that can generate visualizations reliably can be very tricky: - simple chart specs can be reliable, but generated charts are often of low quality due to reliance on system defaults; - complex chart specs with explicit details can produce good-looking charts, but they are verbose and agents can struggle with reliability We figured out it is a limitation on the language issue (not just AI capability thing) -- current visualization languages are a bit too low-level for AI agents, requiring them to explicitly make visual decisions that are supposed to be handled by a good compiler. Flint is a visualization intermediate language to address this issue, allow AI agents to solve this last-mile human-agent interaction problem. It provides a simple semantic-type based specification, and contains a layout optimization engine that can produce good-looking charts (filled with derived low-level details) from simple
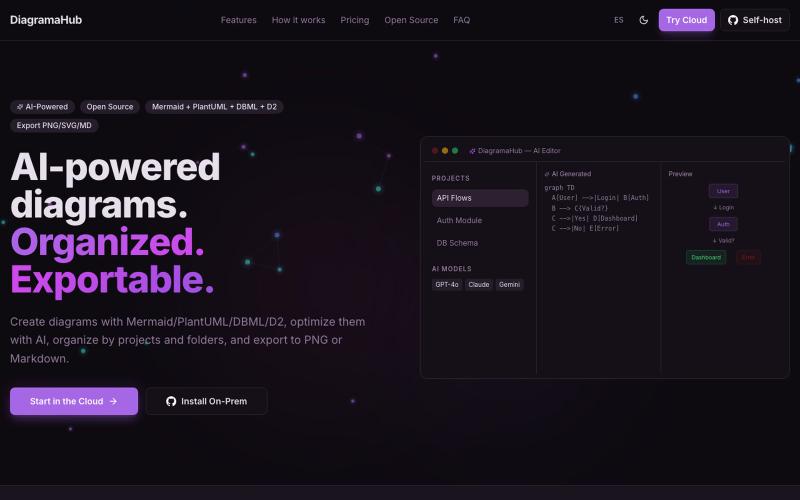
用文字创建和导出图表,支持 Mermaid、PlantUML、D2 等格式。

@soyalexdzul · X
Open-source platform for creating, organizing, and exporting diagrams using plain text markup. It combines the power of Mermaid, PlantUML, and D2 with a polished interface
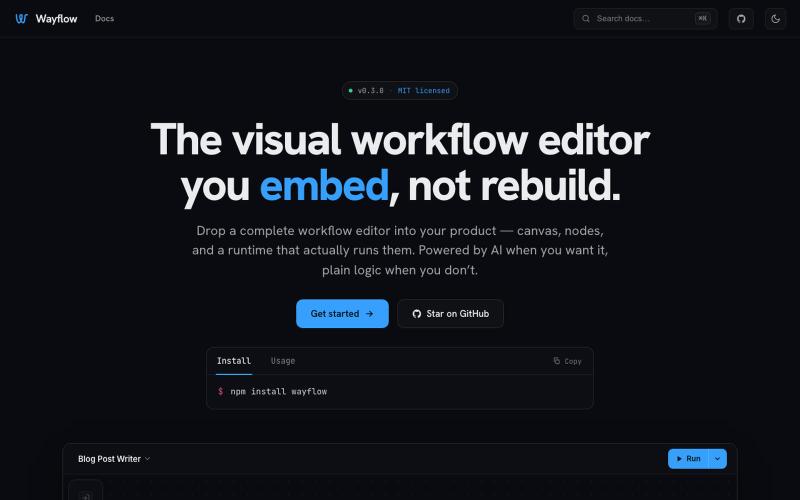
可嵌入的可视化工作流编辑器,支持AI驱动或纯逻辑设计。
tahazsh · HN
Hi! I’m Taha. In many agentic products that support workflows (including one I worked on), I noticed they either don’t support node-based editors, or use React Flow and go through the difficult work of integrating it into their product to run it and work with their existing logic. So I thought about creating a tool that could help with this by closing the gap between the editor and the runtime. That’s why I created Wayflow. The basic architecture is simple: you just need to create a graph (which is a JSON object) that the runtime knows how to run. The runtime doesn’t care where that graph is coming from, it just needs the right schema. And with the help of the editor, you can create the graph, and then export it or directly save it on your backend in your database. And then when you want to execute it, you just hand it to the runtime. The runtime can either stream the execution (which is useful for the editor), or give you the final result. How you execute the graph is up to you: t
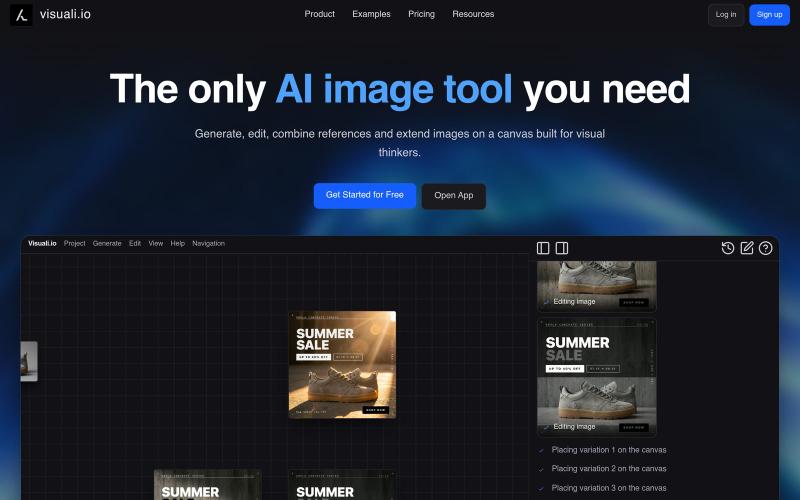
AI 图像编辑与生成工具,在浏览器和移动设备上编辑和扩展图像。
visuali · HN
Like Claude Code for Images

上传发型照和自拍,AI 从三个角度生成完美发型效果图。
u/Traditional_Song4452 · Reddit
19yr old friend and I made an ai haircut tool! Hey all, my friend and I dropped a haircut visualization tool a few weeks ago to cut down onmiscommunication in the barbershop by generating a photo of you with the cut you want from three angles. We have officially launched now with around 25 users and are trying to get more to try it out! The first generation is free so we’d love as many as possible to try it out if you get a minute! Good luck to all your side projects! subm
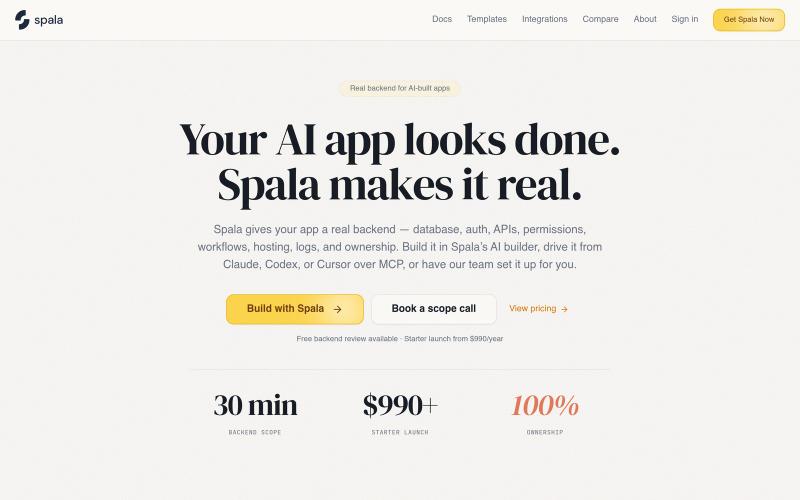

将平面图转为3D虚拟看房工具。

@ShivamMish11788 · X
We've been helping developers and brokers turn floor plans into interactive 3D walkthroughs. Makes it much easier for buyers to visualize the space.
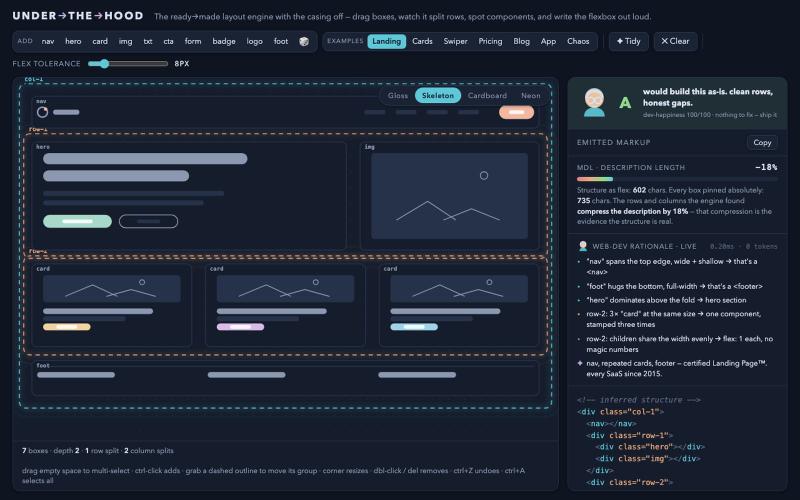
拖动方框体验Flexbox布局引擎的推断过程。
drzivil · HN
Drag boxes around and watch a layout engine infer the Flexbox (no AI)