
教育学习1 month ago
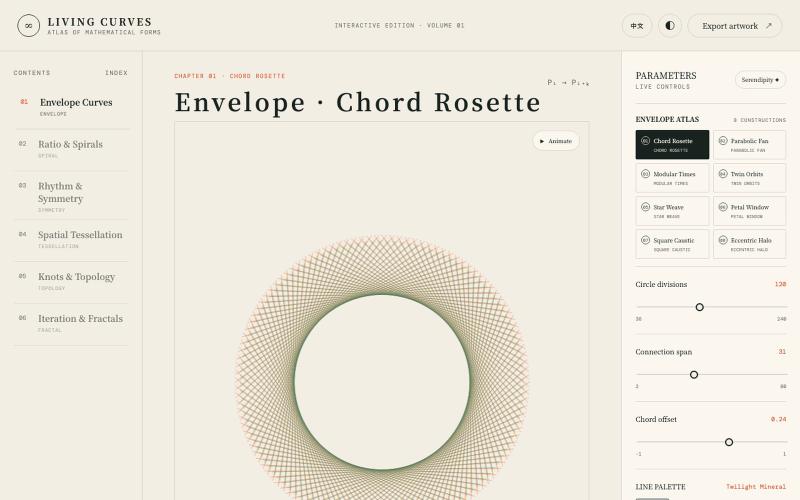
Atlas of Living Curves
探索数学曲线、分形、对称和拓扑的交互式可视化。

@vkuoo · X
Added more demos showcasing graph-math relationships, built with Codex.
完整作品展
技术栈
60 projects
探索数学曲线、分形、对称和拓扑的交互式可视化。
@vkuoo · X
Added more demos showcasing graph-math relationships, built with Codex.
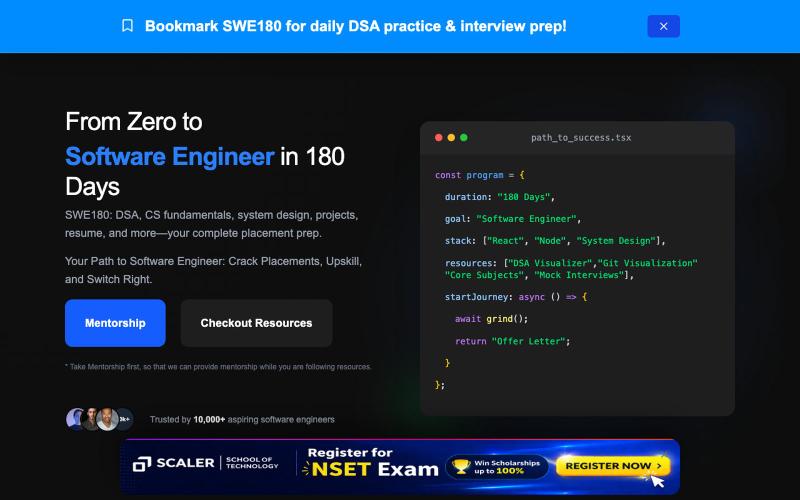
通过交互式可视化学习数据结构和算法,准备技术面试。

@aarsh_30 · X

用AI驱动的审计工具分析系统,包含多个版本。

@jozef_x1 · X
🚨 I Vibe Coded F0ur (4) different versions of @coreyganim's "Ai Audit" Funnel, which is your favourite? VERSION #3:

Flint是为AI代理设计的可视化语言,用于创建交互式数据可视化。
chenglong-hn · HN
Data visualizations are the bridge between user and data. But building AI agents that can generate visualizations reliably can be very tricky: - simple chart specs can be reliable, but generated charts are often of low quality due to reliance on system defaults; - complex chart specs with explicit details can produce good-looking charts, but they are verbose and agents can struggle with reliability We figured out it is a limitation on the language issue (not just AI capability thing) -- current visualization languages are a bit too low-level for AI agents, requiring them to explicitly make visual decisions that are supposed to be handled by a good compiler. Flint is a visualization intermediate language to address this issue, allow AI agents to solve this last-mile human-agent interaction problem. It provides a simple semantic-type based specification, and contains a layout optimization engine that can produce good-looking charts (filled with derived low-level details) from simple

构建AI智能体并在交互式仪表板上实时可视化其执行。

@Aurelsuuu · X
this is my product, come take a look:

CodeFlovio 将代码转换为交互式流程图,便于学习、调试和文档编制。

@Sparsh209 · X
Hi isha! Check it out here at: Would love to hear your feedbacks

将 AI 编码代理的运行转录可视化为交互式图表。
u/Express-Phase1532 · Reddit
rungraph - see what your coding agent actually did, as an interactive graph (open source) My coding agent kept doing 20 minutes of work I couldn't inspect afterward. The transcript exists (Claude Code and Codex CLI write everything to disk), but nobody reads 4,000 lines of JSON. So I built rungraph, open source and free (MIT). npx rungraph turns every session on your machine into a clickable graph: your prompts run down the spine, subagents get their own lanes, and it flags stuff like ret
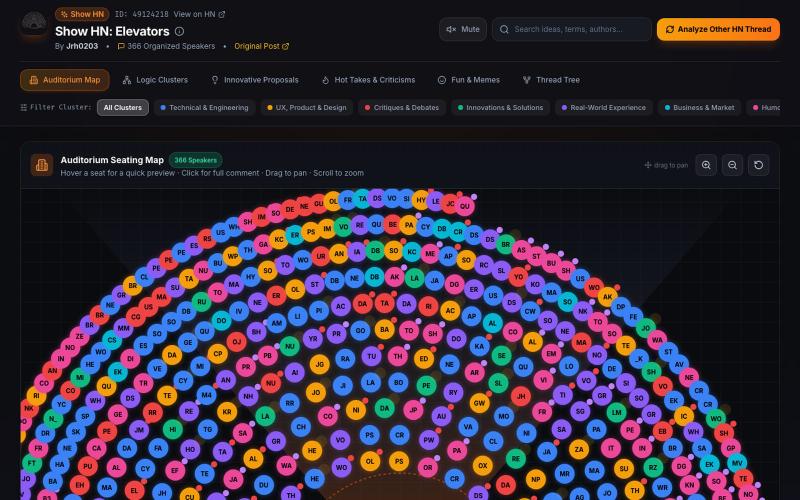
用交互式空间可视化和AI摘要浏览Hacker News讨论。
ahmedxuhri · HN
Postroom – HN thread 2D Visualizer as auditorium AI-powered summaries

将平面图转为3D虚拟看房工具。

@ShivamMish11788 · X
We've been helping developers and brokers turn floor plans into interactive 3D walkthroughs. Makes it much easier for buyers to visualize the space.

将PDF作品集转为portfolico交互式在线展示,多种浏览模式可选。

@il_deil · X
I’m building an interactive, ultra-minimalist portfolio platform strictly for architects & designers, because I tired of ads and clutter ruining portfolio on Issuu and same services. I made zero visual noise. Multiple viewing modes. Just your portfolio
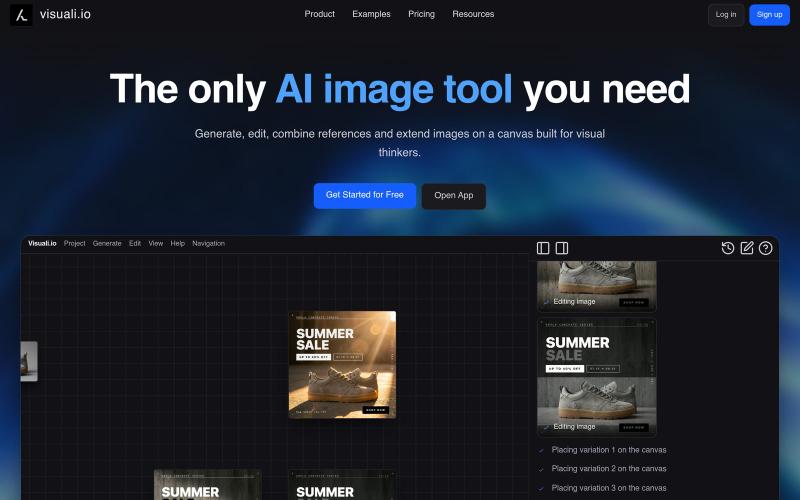
AI 图像编辑与生成工具,在浏览器和移动设备上编辑和扩展图像。
visuali · HN
Like Claude Code for Images
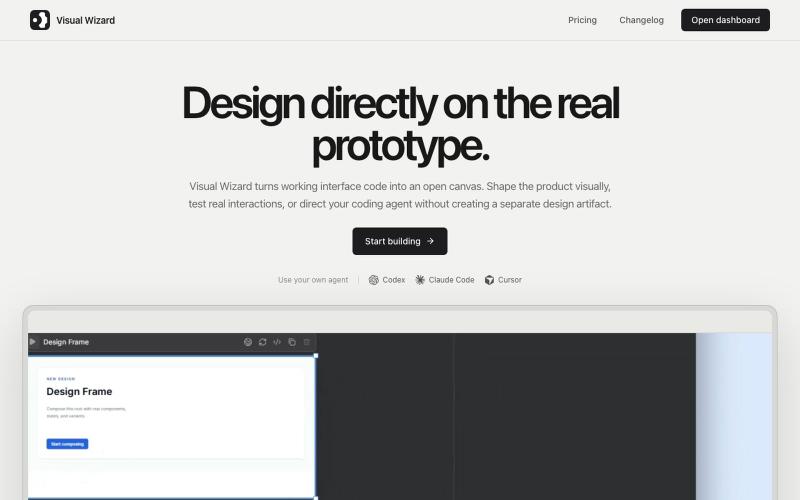
Visual Wizard 是一个视觉工作空间,与编程AI代理实时设计工作原型。
u/tokmako · Reddit
I am developing an alternative work environment to Claude Design. When I first tried Claude Design, I really liked the idea. But after generating a design, I kept wanting a more direct way to continue working on it not as a separate design representation, but as a live, working interface. That’s what I’m building with VisualWizard. The canvas contains real, interactive prototypes. You can select elements directly, move or resize them, change styles, and keep interactions and