
开发者工具8 hours ago
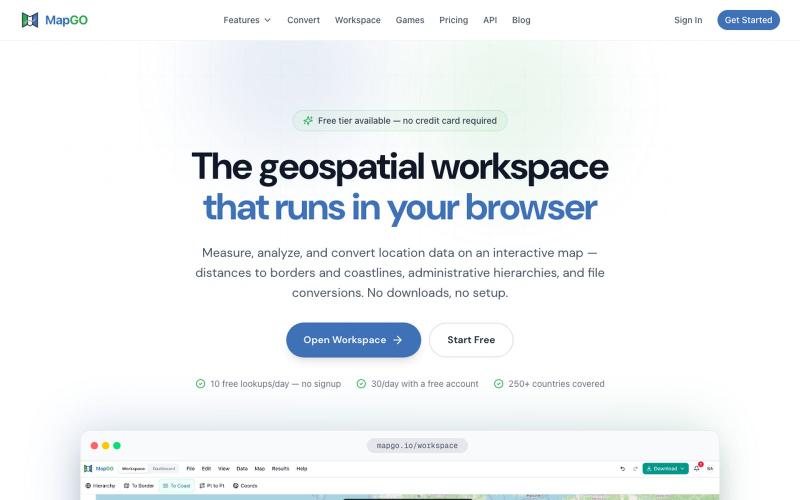
MapGO - Online Mapping Services | GIS Data Software & Geospatial Mapping Platfor
用GIS制图工具分析地理空间数据、计算距离并批量处理CSV文件。

@JanasSebastian · X
完整作品展
技术栈
60 projects
用GIS制图工具分析地理空间数据、计算距离并批量处理CSV文件。
@JanasSebastian · X
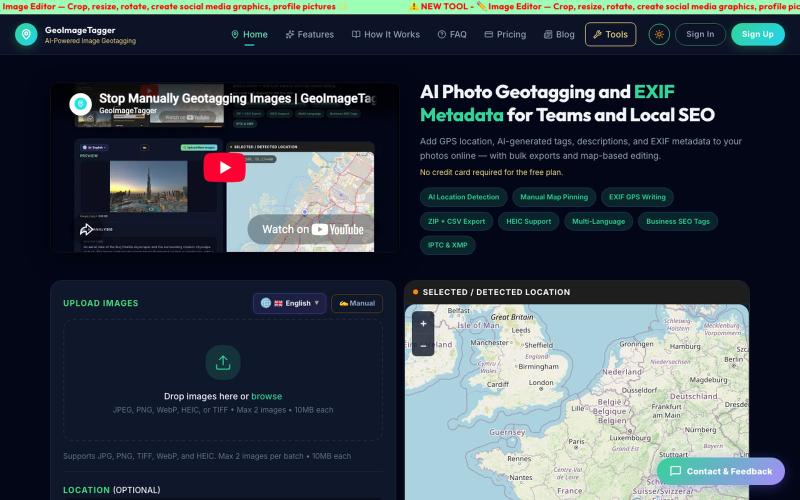
给照片添加地理标签和AI生成的元数据。
tosief · HN
GeoImageTagger – AI image geotagging and metadata editor
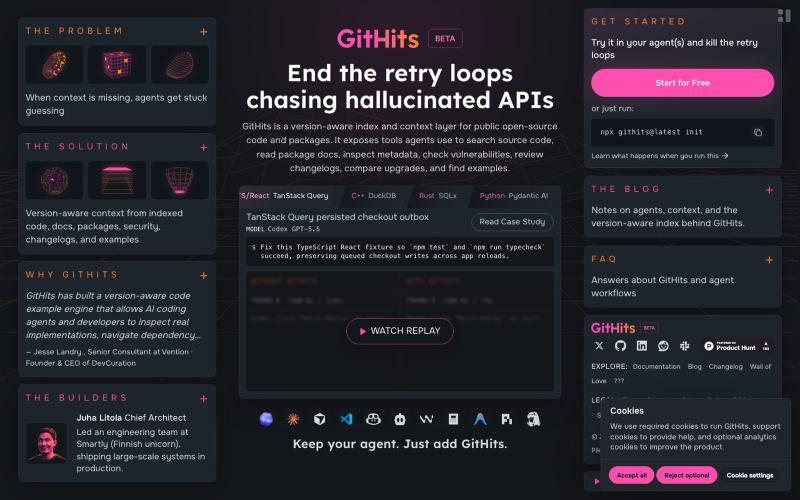
搜索索引化的开源代码和软件包,包含版本、依赖和漏洞信息。

@Jack_Timonen · X
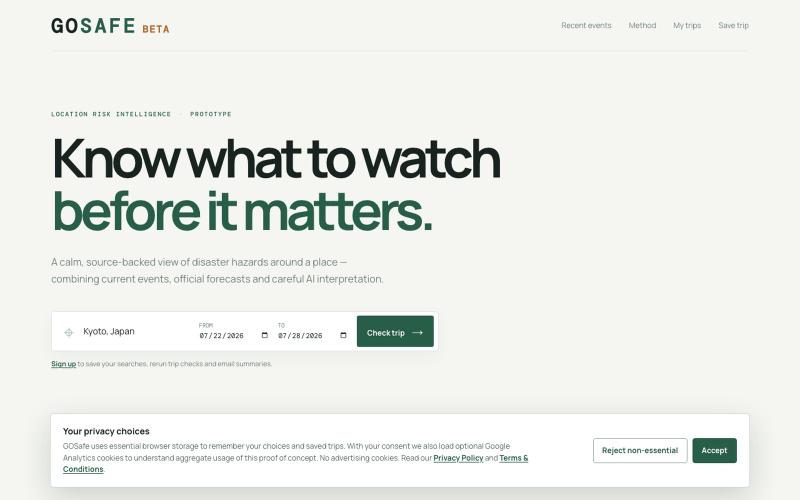
GOSafe:查看旅游目的地的灾害和位置风险

@HappyMonkeyAI · X
GOSafe was another #AI powered #app concept from last week too that aims to help to #travellers stay informed about destinations they are thinking of visiting
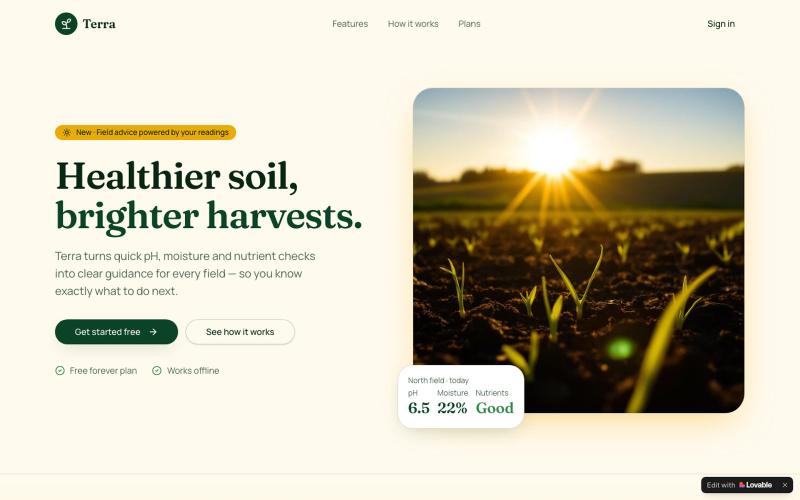
记录土壤pH、水分和养分数据,追踪田地状况并获得AI建议。

@batmanyussif · X
Check out what I just built with Lovable!
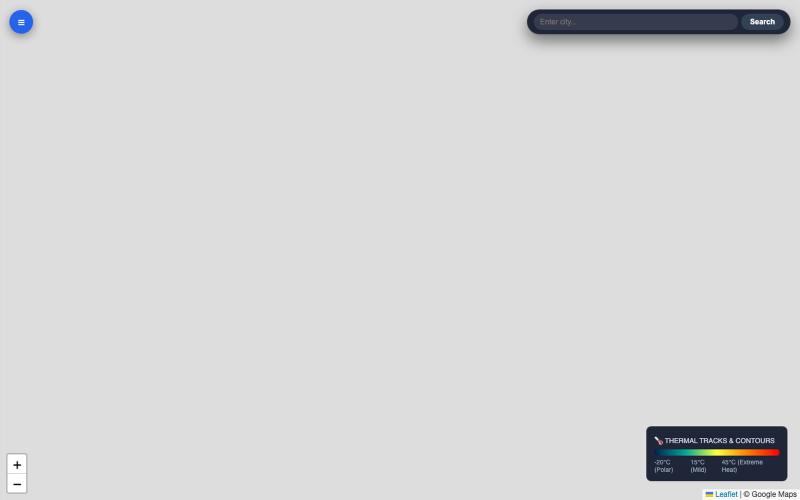
实时交互式天气雷达仪表板,显示大气层、热量等高线和风暴追踪。

@ebrahim_dev3 · X
An interactive, high-contrast weather radar application. The system provides real-time atmospheric visual layers over high-resolution satellite imagery with distinct airflow, thermal contours, and storm tracks.

Flint是为AI代理设计的可视化语言,用于创建交互式数据可视化。
chenglong-hn · HN
Data visualizations are the bridge between user and data. But building AI agents that can generate visualizations reliably can be very tricky: - simple chart specs can be reliable, but generated charts are often of low quality due to reliance on system defaults; - complex chart specs with explicit details can produce good-looking charts, but they are verbose and agents can struggle with reliability We figured out it is a limitation on the language issue (not just AI capability thing) -- current visualization languages are a bit too low-level for AI agents, requiring them to explicitly make visual decisions that are supposed to be handled by a good compiler. Flint is a visualization intermediate language to address this issue, allow AI agents to solve this last-mile human-agent interaction problem. It provides a simple semantic-type based specification, and contains a layout optimization engine that can produce good-looking charts (filled with derived low-level details) from simple
@joovier_ https://t.co/keG2Rl4hD4 data analysis app. Check out

@MourynCher16712 · X
data analysis app. Check out
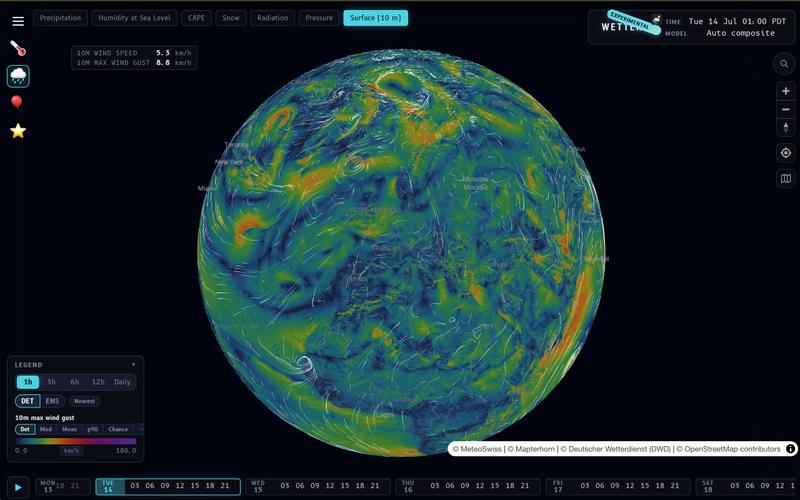
Wetter 支持本地计算和自定义聚合模式的天气预报和可视化应用。
__mp · HN
I built my own weather prediction / visualization app: https://wx.rsp.li (on-device temperature lapsing, on device interpolation modes, user-selectable aggregations, etc…). One of these days I should do a writeup. I also asked Claude to build a photo gallery for me https://places.pascalspoerri.ch (HDR, map support, similar images)
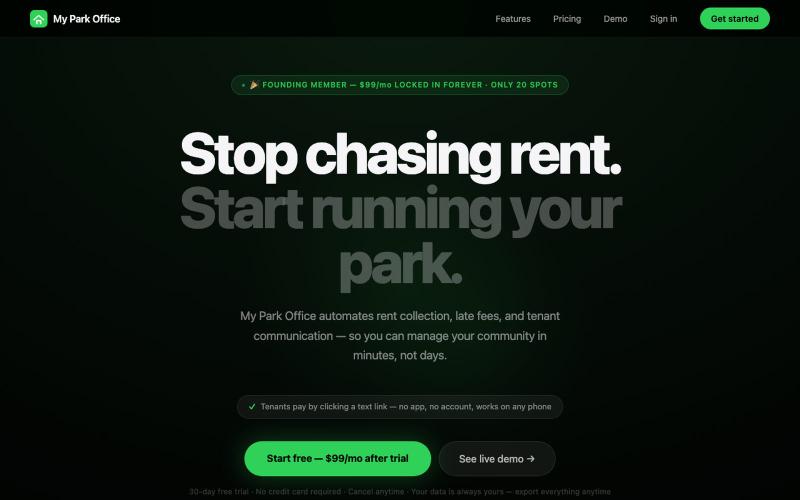
通过短信收租、数字租约和维护跟踪管理移动房屋公园。
u/TheeCloutGenie · Reddit
RV Park SAAS So that I’ve used wispr flow to help write this so it’s a disclaimer. I recently built myparkoffice.com , and to be honest, it started as total "AI slop." I asked AI to identify a "pen and paper" industry that was ripe for AI disruption. When it suggested RV parks, I thought I’d struck gold. A low-tech niche with clear inefficiencies? Sounds like the perfect solo-founder dream, right? I leaned heavily into AI to build the entire thing, treating it more like a fun experiment th
创建流程图、程序图、组织架构和UML图的免费在线工具。

@N0V4Dev · X
I found a tool called Next AI that links AI capabilities directly with diagrams. It lets you build and edit diagrams using natural language prompts instead of clicking around the canvas manually. It's a handy way to sketch out architecture when you don't want to drag every box yourself. The project is built on TypeScript with React 19 and Next.js. It supports multiple AI providers and even includes an MCP Server. This means you can use it with the Claude Code CLI to generate diagrams from your terminal. Deployment options are flexible too. You can run the tool locally with Docker or push it to Vercel and Cloudflare Workers. It supports multi provider setups so you can pick the backend that fits your workflow. #Nextjs #AI #Diagrams #TypeScript
