
教育学习1 month ago
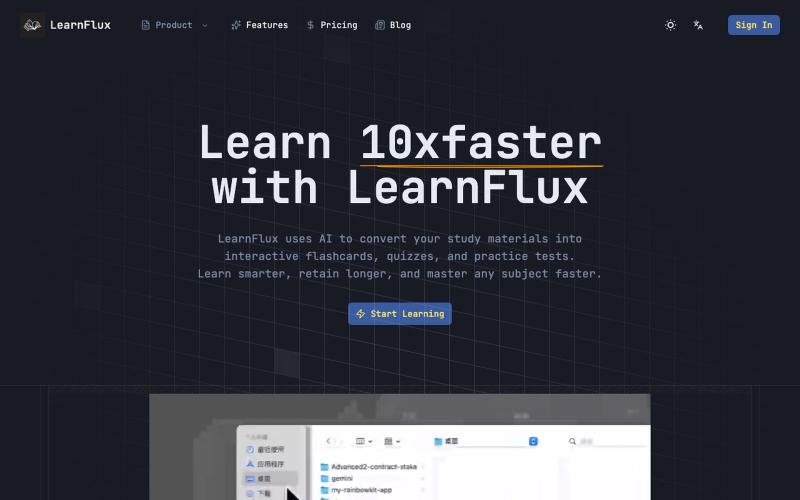
LearnFlux
AI驱动的智能学习助手,生成个性化学习材料,让你快速掌握知识。
LearnFlux — AI 驱动的智能学习助手,为你生成个性化学习材料,让你以更少时间掌握更多知识。
完整作品展
技术栈
60 projects
AI驱动的智能学习助手,生成个性化学习材料,让你快速掌握知识。
LearnFlux — AI 驱动的智能学习助手,为你生成个性化学习材料,让你以更少时间掌握更多知识。
A product of emergent.sh

@WAngaama42602 · X
World Rules down here

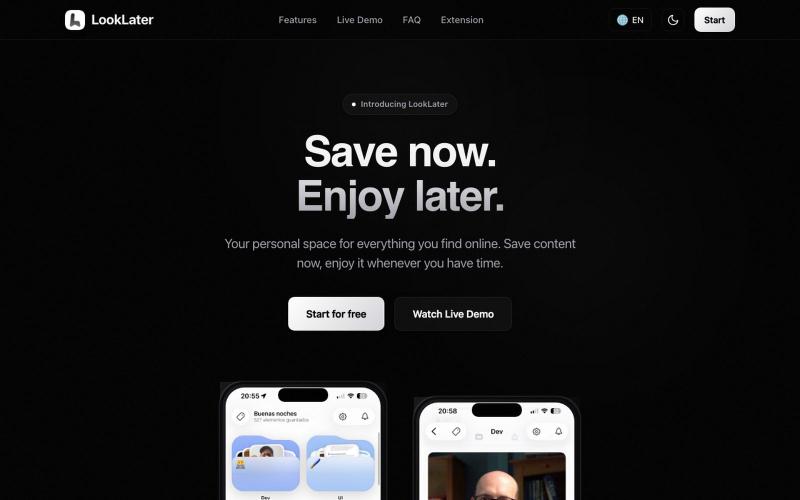
@TanzilaSha9574 https://t.co/7Q2Q1CmJzb

@looklaterapp · X
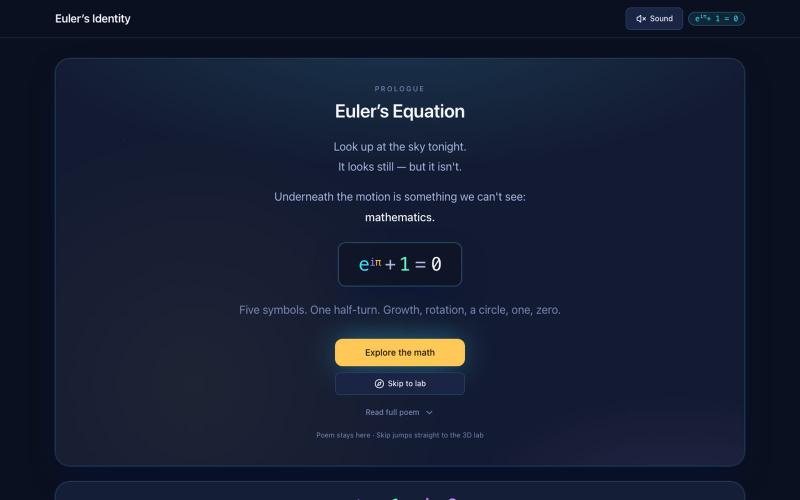
通过交互式3D复平面可视化探索欧拉恒等式 e^{iπ} + 1 = 0。

@Sabrina7772 · X
I built my first app with Grok Build and had a lot of fun making it. It’s a little interactive lab for e^{iπ}+1=0. You start at 1, turn halfway around the circle, land on −1, then add 1 — and you can actually see why the equation works. Code: Any feedback is appreciated
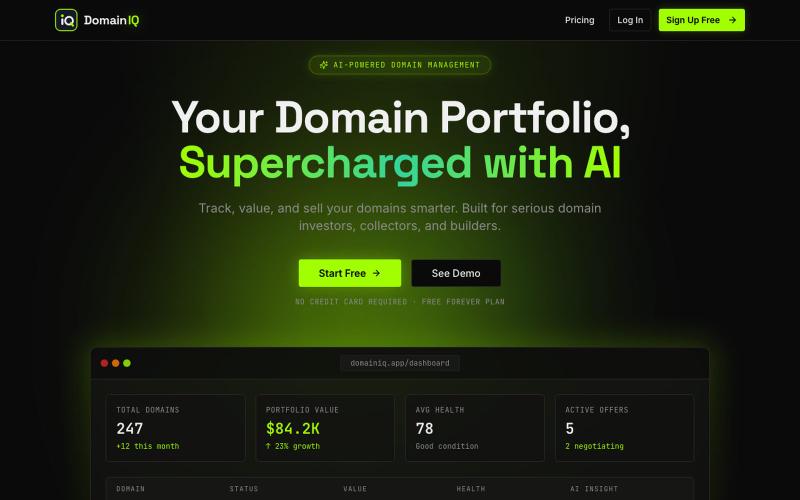
DomainIQ is an AI-powered domain portfolio manager for investors and builders. Track renewals, get instant valuations, manage offers and sales, and make smarter decisions about you

@ftwsourav · X
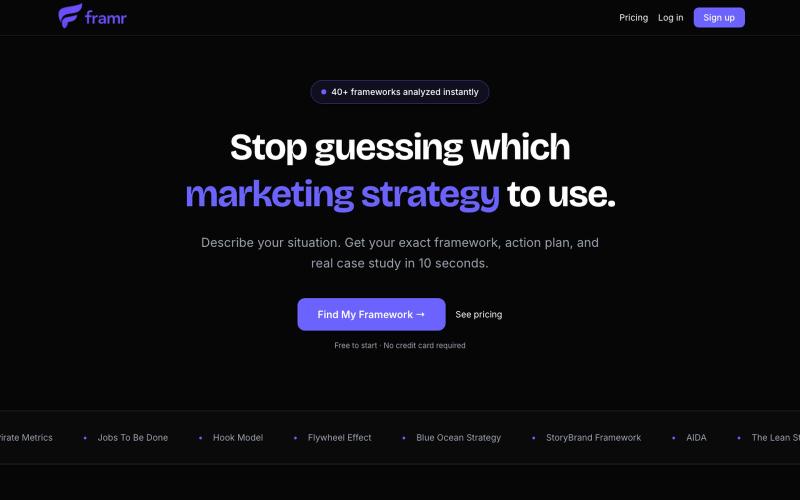
Describe your situation. Get your exact marketing framework, step-by-step action plan, and real case study instantly. AI-matched from 40+ proven frameworks.

@framrcc · X
Framr is an AI growth strategist that matches founders and marketers with the right growth framework based on their business, stage, and goals in 10 seconds

Flint是为AI代理设计的可视化语言,用于创建交互式数据可视化。
chenglong-hn · HN
Data visualizations are the bridge between user and data. But building AI agents that can generate visualizations reliably can be very tricky: - simple chart specs can be reliable, but generated charts are often of low quality due to reliance on system defaults; - complex chart specs with explicit details can produce good-looking charts, but they are verbose and agents can struggle with reliability We figured out it is a limitation on the language issue (not just AI capability thing) -- current visualization languages are a bit too low-level for AI agents, requiring them to explicitly make visual decisions that are supposed to be handled by a good compiler. Flint is a visualization intermediate language to address this issue, allow AI agents to solve this last-mile human-agent interaction problem. It provides a simple semantic-type based specification, and contains a layout optimization engine that can produce good-looking charts (filled with derived low-level details) from simple
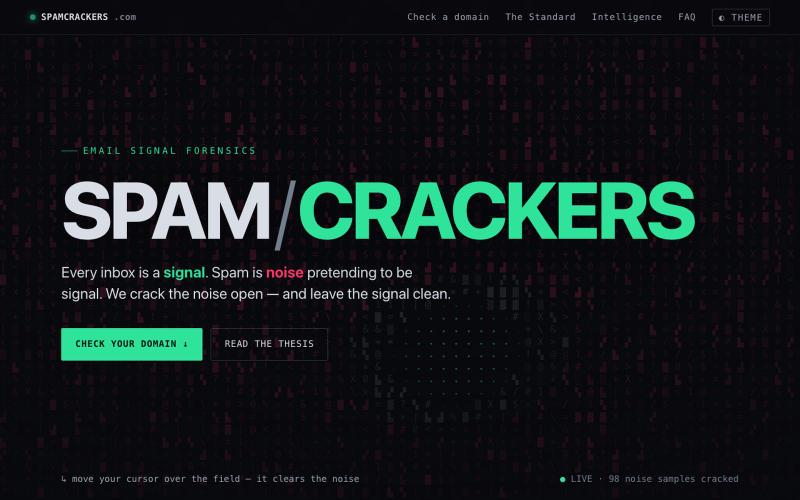
检查域名电子邮件保护等级,评估SPF、DKIM、DMARC和MX记录。

@domainfyrbrand · X
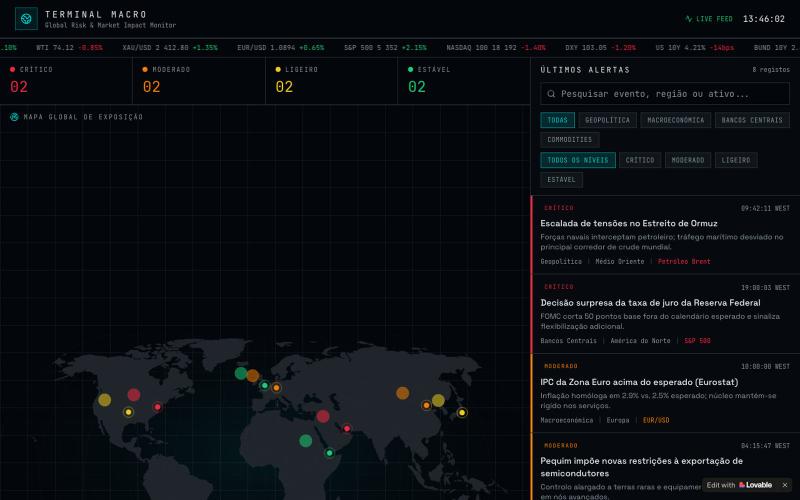
在交互式世界地图上监控全球宏观经济与地缘政治风险及实时预警。

@ec9300 · X
Check out what I just built with Lovable!


