
社交社区1 month ago
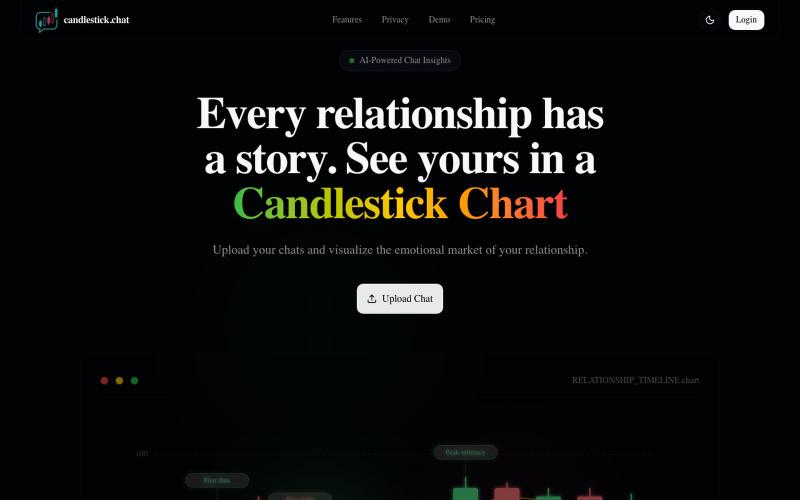
Relationship Candlestick | Visualize Your Emotional Market
上传聊天记录,以烛台图表形式可视化你的关系情感趋势。

@Henry_Yangs · X
完整作品展
技术栈
61 projects
上传聊天记录,以烛台图表形式可视化你的关系情感趋势。
@Henry_Yangs · X
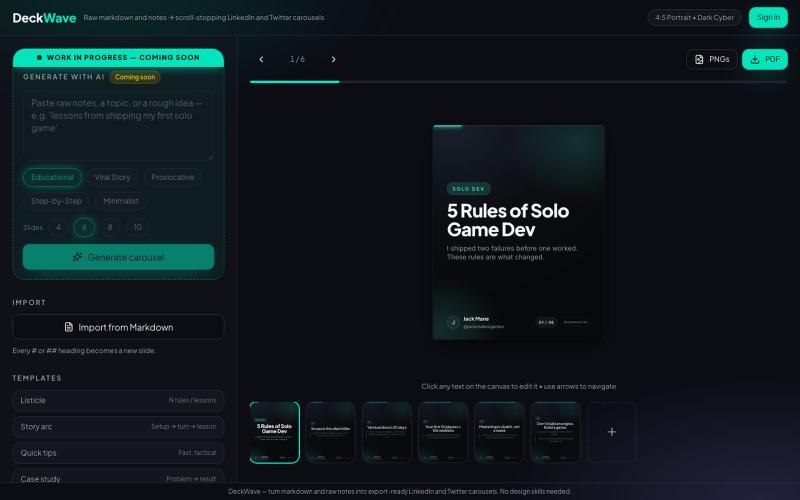
Convert plain Markdown notes into clean PDF and PNG carousels for LinkedIn and X in seconds without Canva or complex design tools.

@mrdeathpl · X
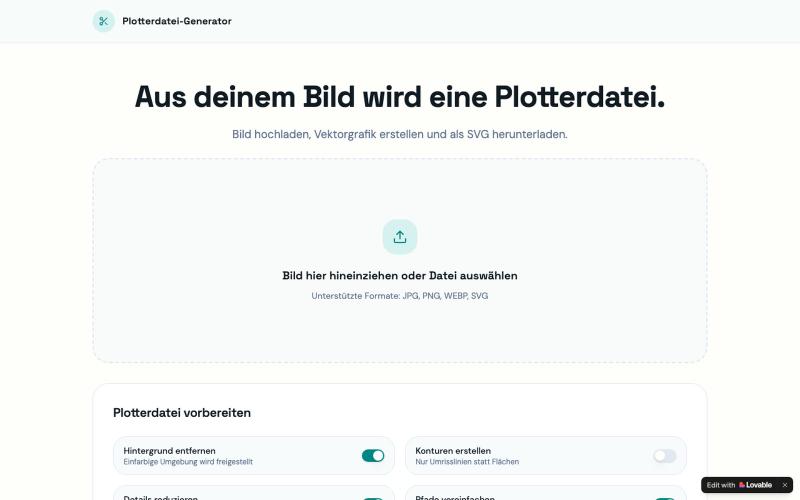
上传图像并将其转换为 SVG 矢量文件,用于切割绘图机。

@PlotterAI01 · X
Check out what I just built with Lovable!
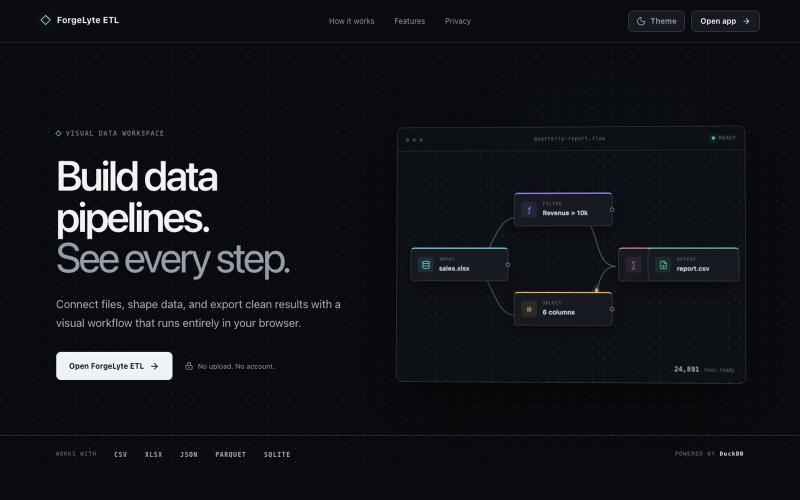
为 CSV、Excel、JSON 和 Parquet 文件创建可视化数据 ETL 管道。

@ashkans_dev · X
An ETL tool:
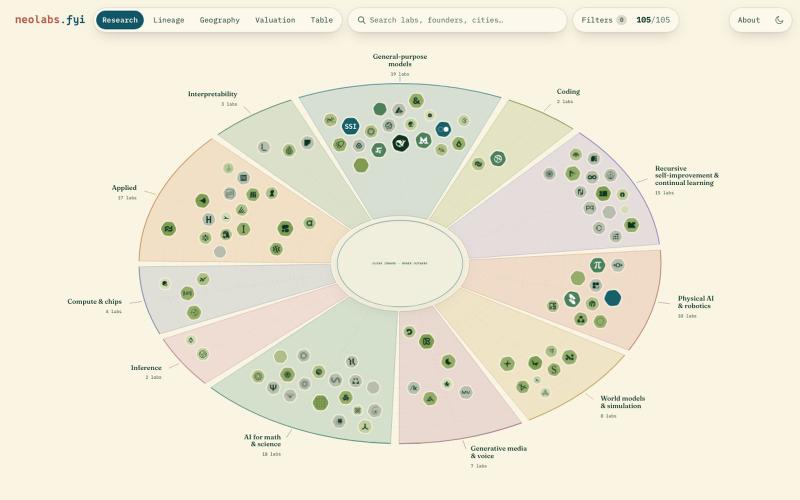
AI实验室交互式地图,按估值、地域和研究方向可视化展示。
polyphilz · HN
Neolabs.fyi – 100 new AI labs by research area, valuation, and more

监控埃及股票交易所机会,使用 EGP 10,000 虚拟资本练习交易。

@alsyadHanish · X
Check out what I just built with Lovable!
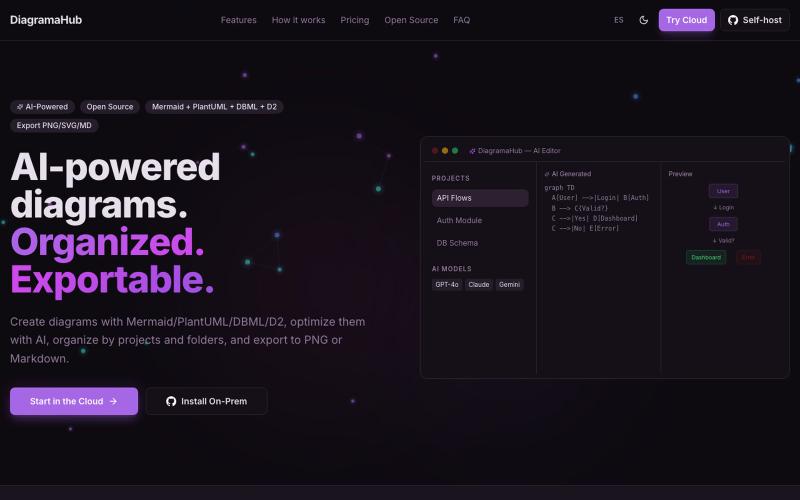
用文字创建和导出图表,支持 Mermaid、PlantUML、D2 等格式。

@soyalexdzul · X
Open-source platform for creating, organizing, and exporting diagrams using plain text markup. It combines the power of Mermaid, PlantUML, and D2 with a polished interface

生成并自定义二维码,支持添加logo、追踪扫描,导出PNG或SVG。

@rahuld1506 · X

家务管理应用,通过游戏化方式完成家务任务并追踪家庭零用钱。

@bendrumin · X
I built nights and weekends as a solo founder. 📱 130+ users worldwide, paying subscribers, zero churn 🤖 Built AI-native with Claude Code + Cursor (React/Supabase) My day job: PM owning 13 partner integrations at a wealthtech CRM, where I cut client onboarding from 4-6 weeks to 1-2. Now looking for my next thing: Integration/Platform PM or technical PM roles. DMs open 👇 #buildinpublic #ProductManagement #hiring #opentowork
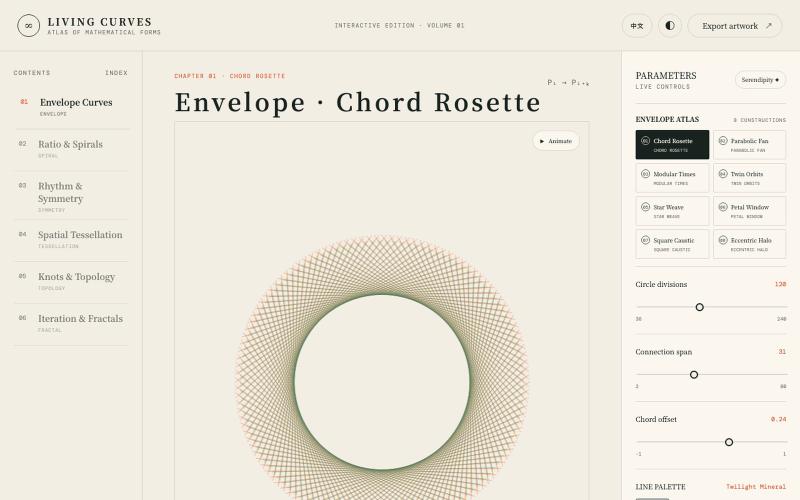
探索数学曲线、分形、对称和拓扑的交互式可视化。

@vkuoo · X
Added more demos showcasing graph-math relationships, built with Codex.
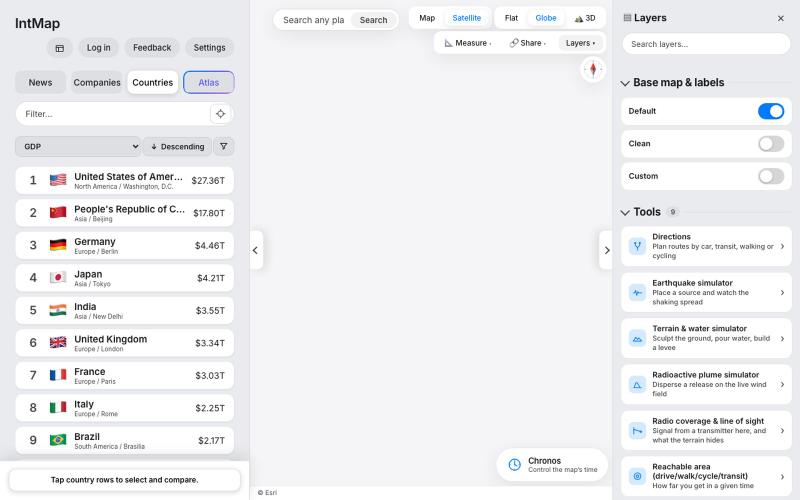
交互式世界地图,支持自然语言查询,可探索地理、气候、历史和全球事件。
u/wi-fipassword · Reddit
I’ve been working on a map for exploring global news, weather and other data I’ve been building this for the past few months. You can try it here: https://rwmqx7dwb5-arch.github.io/IntMap/ The original idea was just to have different kinds of global information available on one map instead of jumping between separate sites. It currently includes things like news, weather, warnings, earthquakes, flights, demographic/geographic data, and an AI interface for exploring the
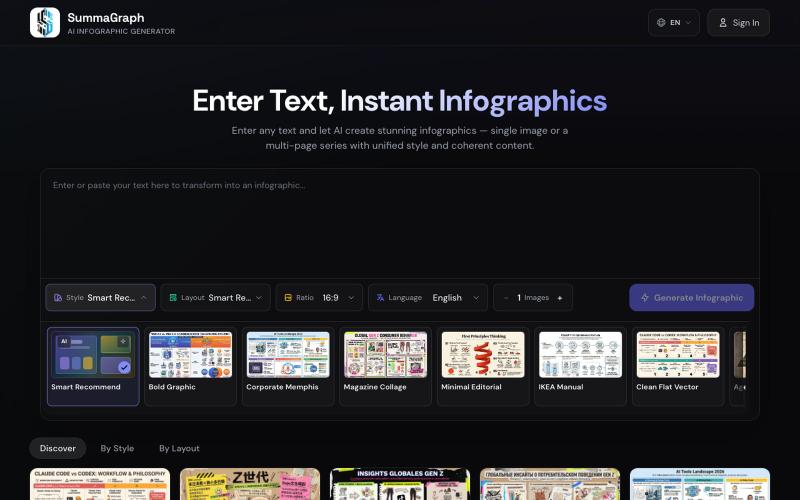
Summagraph 用 AI 将文本转换为信息图,提供 17 种风格和 20 种布局选择。
SummaGraph — AI 信息图生成工具,粘贴任意形式的文本即可一键生成高质量信息图,内置 20 种视觉风格 × 20 种布局模板,支持系列模式一次生成多页风格连续的信息图,覆盖中英日韩等 9 种语言