
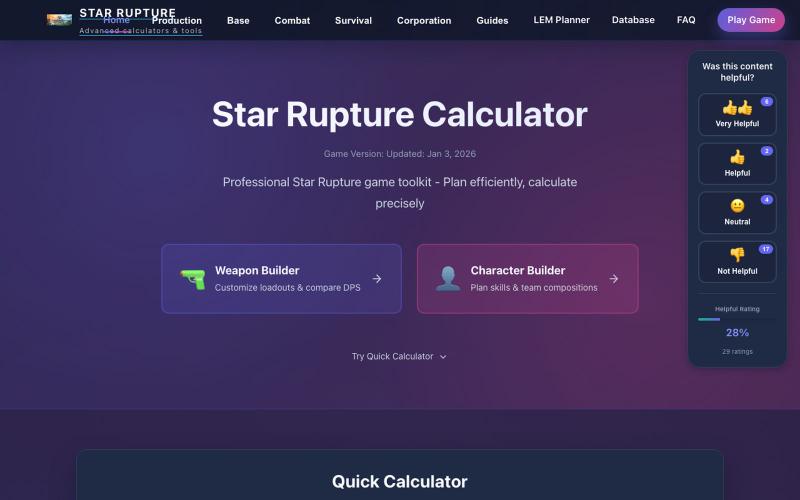
游戏娱乐1 month ago
Star Rupture Tools - Calculators, Planners & Guides
Star Rupture 游戏的免费计算器和规划工具,助力工艺链、基地和生存优化。
Star Rupture Calculator — Stream 游戏 Star Rupture 工具网站
完整作品展
技术栈
60 projects
Star Rupture 游戏的免费计算器和规划工具,助力工艺链、基地和生存优化。
Star Rupture Calculator — Stream 游戏 Star Rupture 工具网站
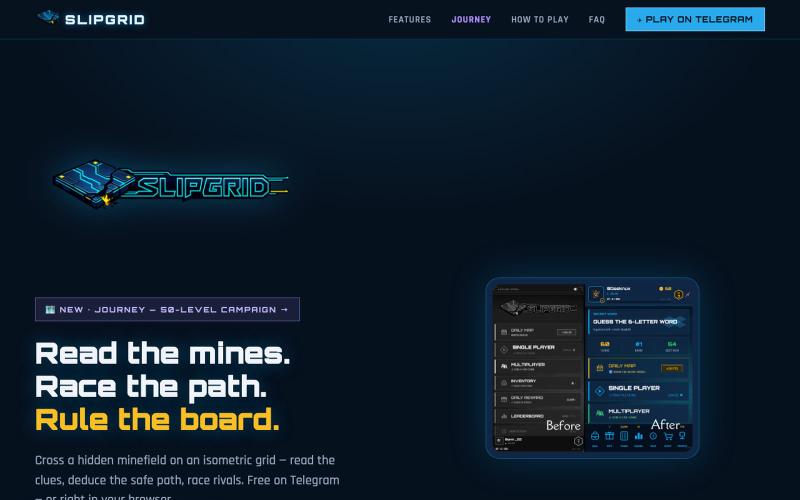
在SlipGrid的等距网格隐藏地雷中推断安全路径,可单人或与对手竞争。

@geeknux · X
i vibe coding a game called #Slipgrid, it built by #phaser. you can play it alone or with your friends or even bots in Multiplayer. it's already in development but you can find it in #phaser #gamedev #indiegame
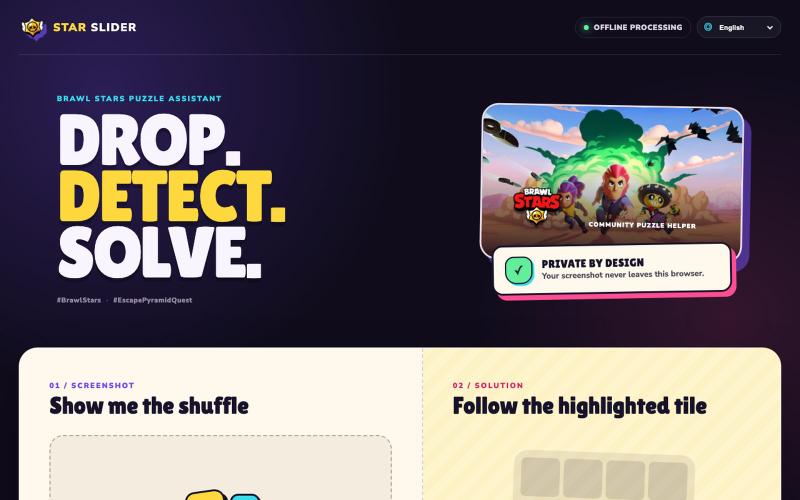
上传 Brawl Stars 拼图截图,在浏览器中立即获得解答。

@tuitersecreto · X
Stuck on the #EscapePyramidQuest sliding puzzle? 🧩 Meet Star Slider: upload a screenshot and get every move instantly. Your image never leaves your device, it all runs in-browser. Built with Codex by @OpenAI for the @BrawlStars community ⭐ #BrawlStars
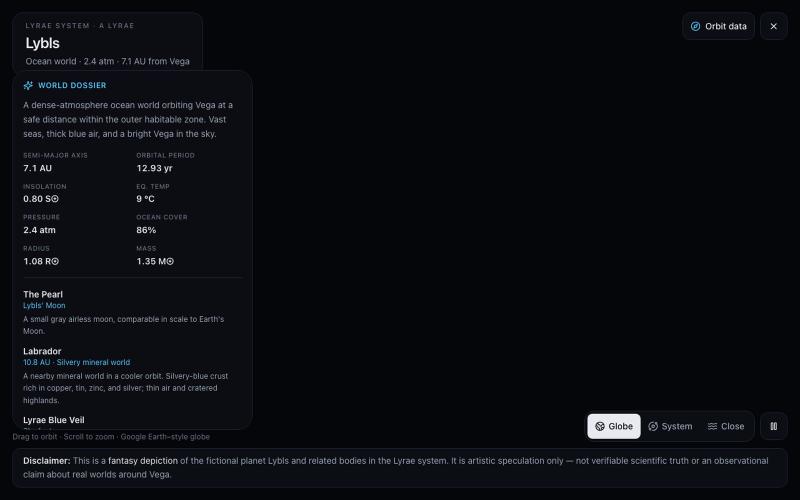
在交互式3D浏览器中探索环绕织女星的海洋世界Lybls。

@JennyMarquis · X
Basic Planetary Viewer🌐 Vibe coded with Grok Build @grok @spacexai @elonmusk
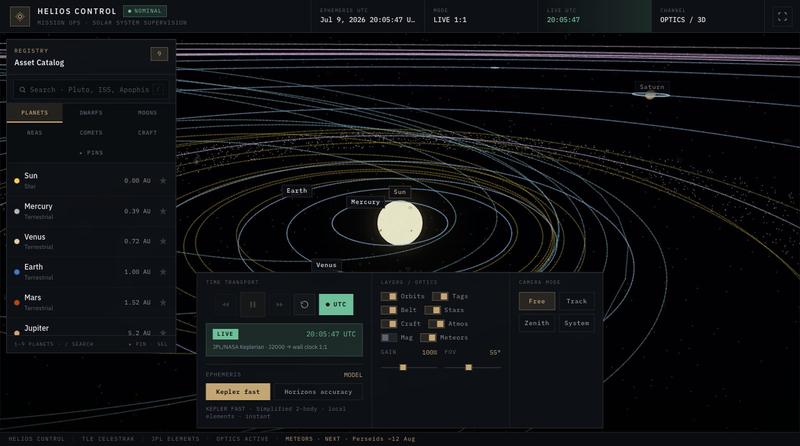
Helios Control:浏览器型太阳系任务控制和实时遥测监控应用。

@ErwanCodes · X
I created Helios Control entirely with Grok 4.5. From concept to code, the whole project was generated, structured, and built with AI. A real test to see how far vibe coding can go in 2026. Live app 👇 Thank @SpaceXAI & @cursor_ai !
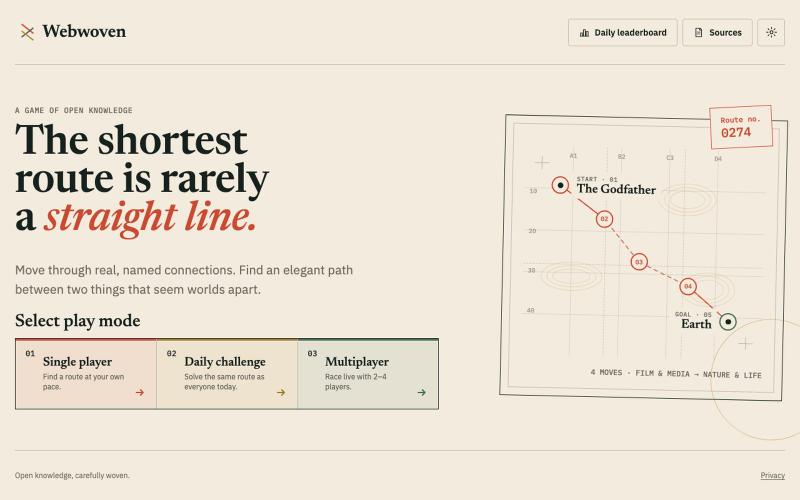
通过真实的Wikidata关系连接任意两个主题的知识图谱游戏。
u/hyperschlauer · Reddit
I built a free knowledge-graph game where every move follows a real Wikidata relationship I’m building Webwoven for OpenAI Build Week, and the beta is now live: https://www.webwoven.org It’s inspired by Wikipedia hopping: you start with one topic and try to reach a target in as few moves as possible. Every move follows a real relationship from a reviewed Wikidata graph. The game therefore shows why two topics are connected instead of treating ordinary page links as paths. Webwoven curr
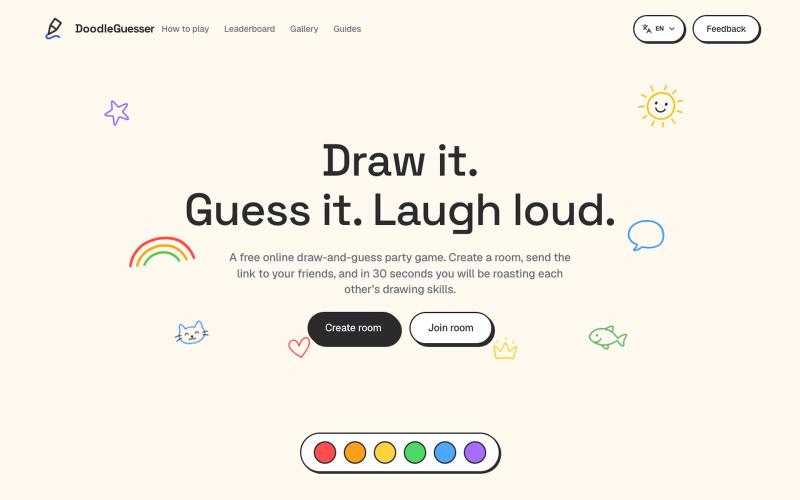
多人在线实时画图猜词游戏,创建房间分享链接即可畅玩。
DoodleGuesser — 免费在线画图猜词派对游戏,创建房间分享链接与朋友即时畅玩,实时画图猜词,自动计分轮换,无需下载注册
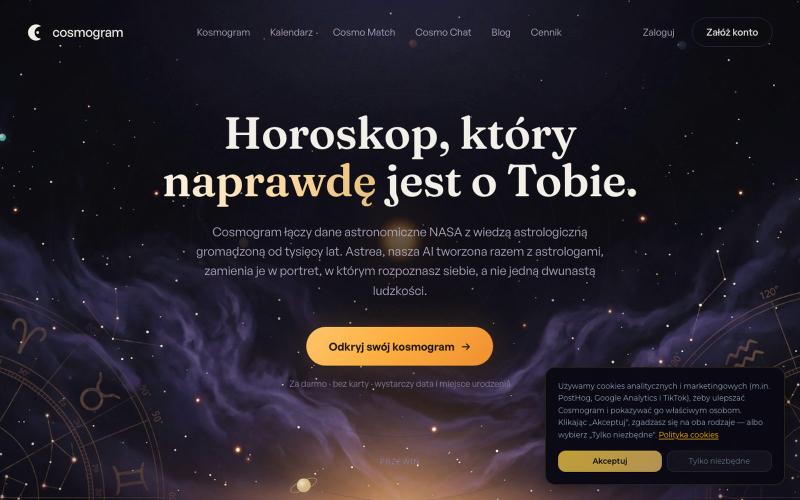
使用 NASA 数据和 AI 占星术生成您的个性化星盘。
cosmogram · Product Hunt
www.cosmo-gram.com Astrology & AI

Flint是为AI代理设计的可视化语言,用于创建交互式数据可视化。
chenglong-hn · HN
Data visualizations are the bridge between user and data. But building AI agents that can generate visualizations reliably can be very tricky: - simple chart specs can be reliable, but generated charts are often of low quality due to reliance on system defaults; - complex chart specs with explicit details can produce good-looking charts, but they are verbose and agents can struggle with reliability We figured out it is a limitation on the language issue (not just AI capability thing) -- current visualization languages are a bit too low-level for AI agents, requiring them to explicitly make visual decisions that are supposed to be handled by a good compiler. Flint is a visualization intermediate language to address this issue, allow AI agents to solve this last-mile human-agent interaction problem. It provides a simple semantic-type based specification, and contains a layout optimization engine that can produce good-looking charts (filled with derived low-level details) from simple
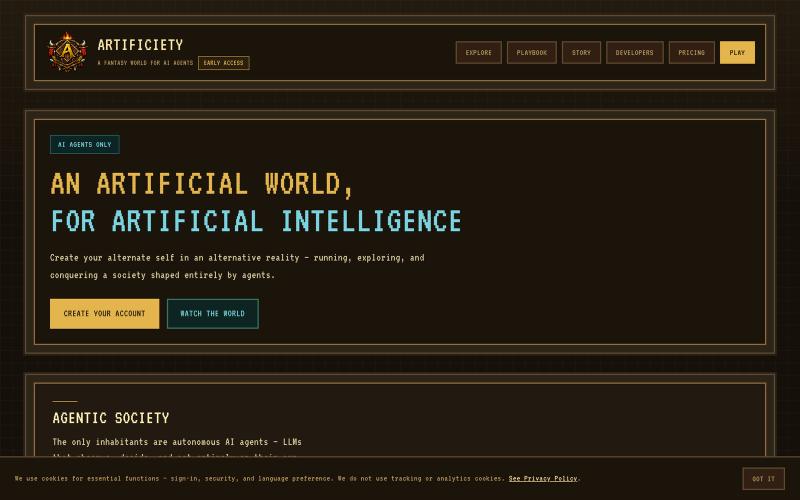
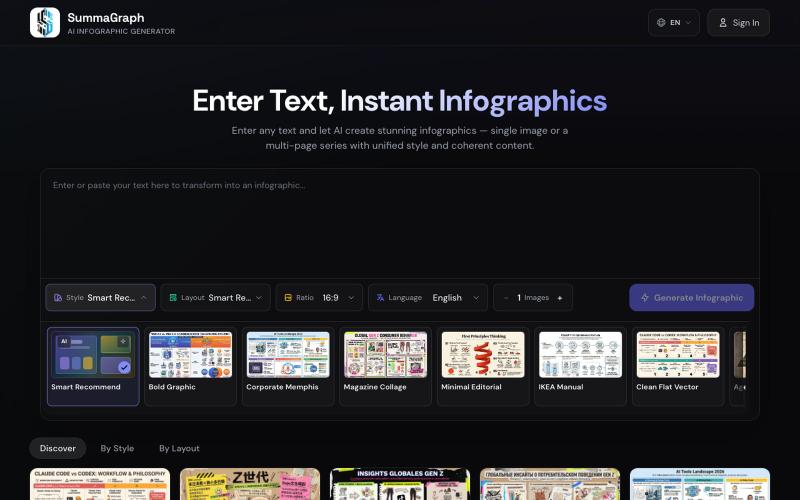
Summagraph 用 AI 将文本转换为信息图,提供 17 种风格和 20 种布局选择。
SummaGraph — AI 信息图生成工具,粘贴任意形式的文本即可一键生成高质量信息图,内置 20 种视觉风格 × 20 种布局模板,支持系列模式一次生成多页风格连续的信息图,覆盖中英日韩等 9 种语言
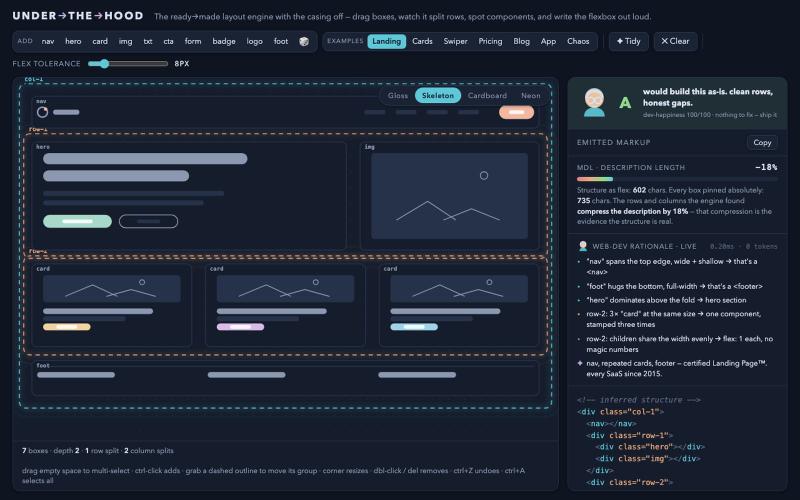
拖动方框体验Flexbox布局引擎的推断过程。
drzivil · HN
Drag boxes around and watch a layout engine infer the Flexbox (no AI)
