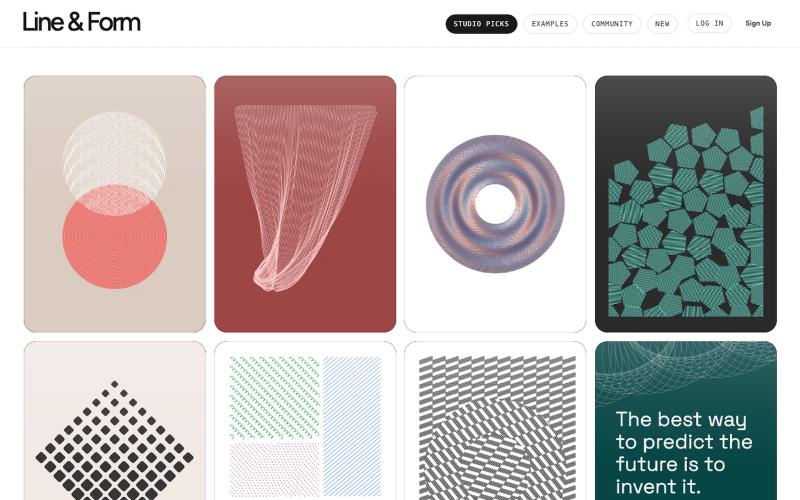
Applied Craft Line & Form
用线条和形状在浏览器中设计视觉艺术
@josephflaherty · X
by @golnik is the best vibe-coded software project I've seen, both in its aesthetics and the difficulty of its accomplishment. You can see the finished output of his work here:
完整作品展
技术栈
62 projects

用线条和形状在浏览器中设计视觉艺术
@josephflaherty · X
by @golnik is the best vibe-coded software project I've seen, both in its aesthetics and the difficulty of its accomplishment. You can see the finished output of his work here:

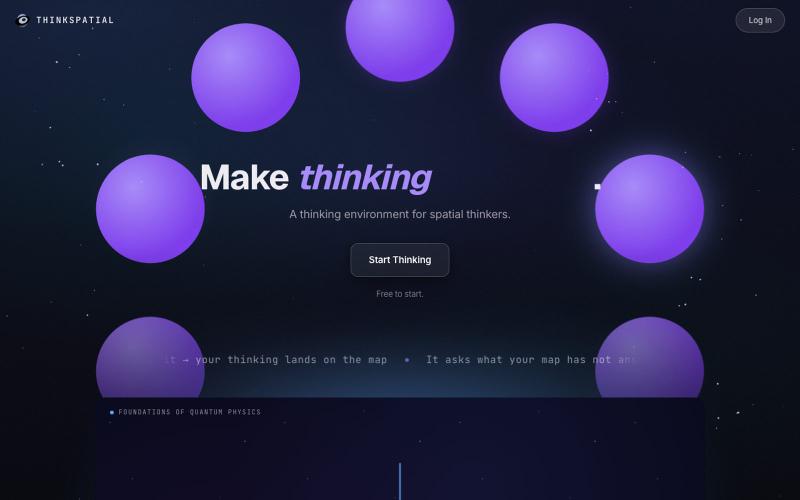
将想法组织为视觉地图,提取关键见解并转化为文档和演讲稿。
u/shadowosa1 · Reddit
I rebuilt my landing page after 300+ visitors still didn’t understand what my app does. I’ve been building a spatial thinking environment called ThinkSpatial, and one of the hardest parts hasn’t been building the product. It’s been explaining what it is in the first few seconds. The basic idea is simple. You speak or type, and your thinking gets turned into a visual map instead of disappearing into a chat box, doc, or note-taking app. My first landing page was way too focused on showing h

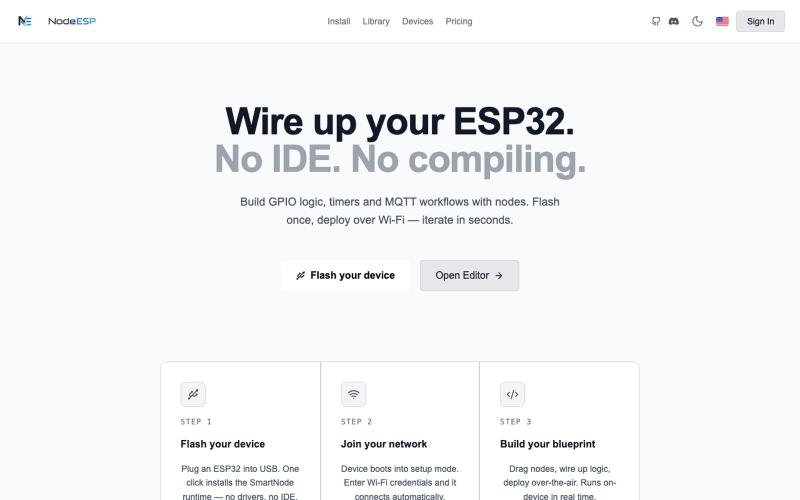
NodeESP是ESP32的可视化编程工具,通过节点拖拽创建GPIO逻辑和MQTT工作流。
@NodeESP · X
- Project for sale

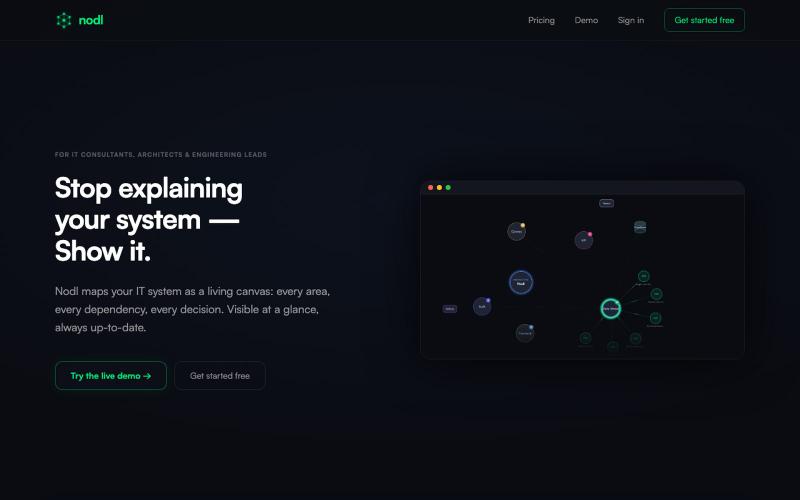
为IT系统架构创建自动与Jira同步的可视化地图。
@erelof1 · X
Nodl ( Automates visual system architecture maps directly from live Jira sync, so dev teams never have to manually draw outdated diagrams in Lucidchart or Confluence again.

Flint是为AI代理设计的可视化语言,用于创建交互式数据可视化。
chenglong-hn · HN
Data visualizations are the bridge between user and data. But building AI agents that can generate visualizations reliably can be very tricky: - simple chart specs can be reliable, but generated charts are often of low quality due to reliance on system defaults; - complex chart specs with explicit details can produce good-looking charts, but they are verbose and agents can struggle with reliability We figured out it is a limitation on the language issue (not just AI capability thing) -- current visualization languages are a bit too low-level for AI agents, requiring them to explicitly make visual decisions that are supposed to be handled by a good compiler. Flint is a visualization intermediate language to address this issue, allow AI agents to solve this last-mile human-agent interaction problem. It provides a simple semantic-type based specification, and contains a layout optimization engine that can produce good-looking charts (filled with derived low-level details) from simple


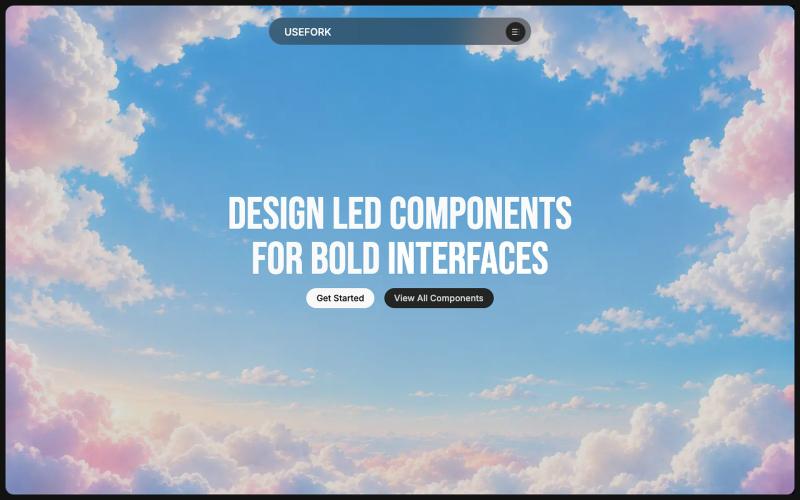
A collection of design led components built for modern interfaces.
@partharora9128 · X

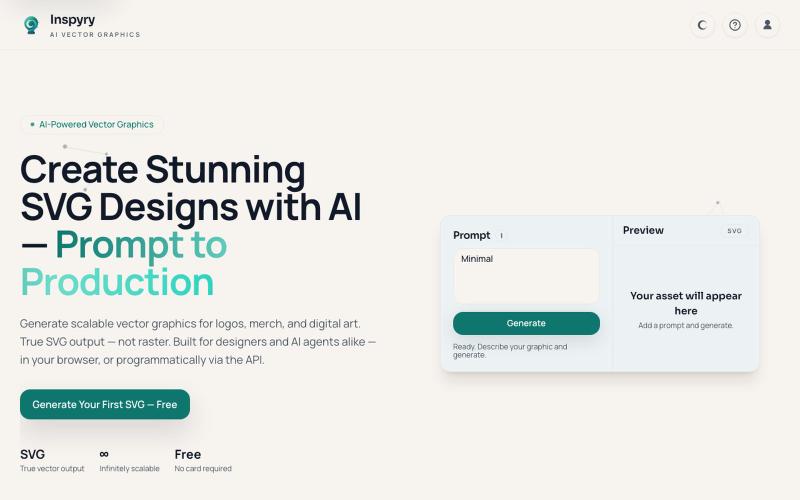
通过AI从创意文案生成可编辑的SVG图标和插图。
drjzlyan · HN
Inspyry – AI Based SVG Generator Platform

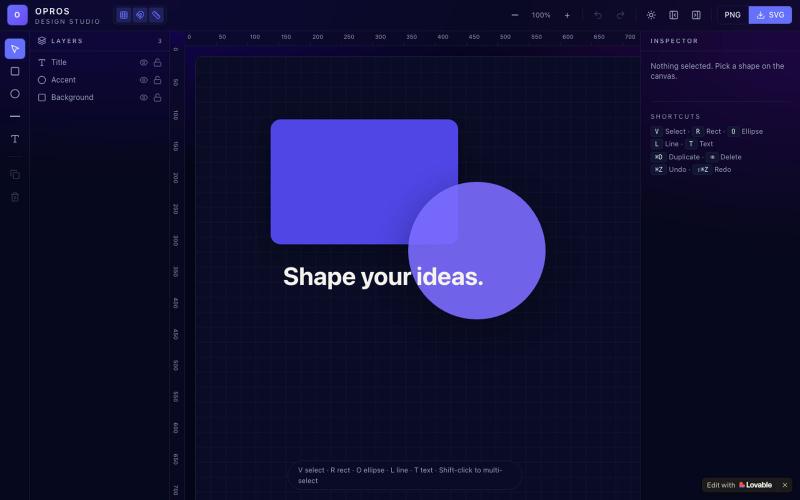
在网络上创建和可视化设计的创意工作室OPROS Design Studio。
@OprosOlamiflex · X
Check out what I just built with Lovable!

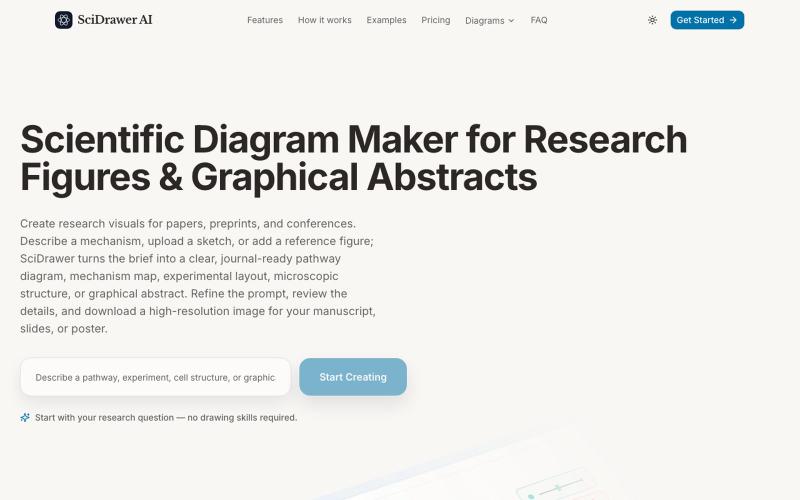
SciDrawer:从文字描述、手绘草图或参考图片生成科学研究图表。
zyrliuwei · V2EX
SciDrawer:基于人工智能的科学图表生成工具 SciDrawer 是一个专为科究人员设计的专业人工智能平台,可帮助他们即时生成符合期刊要求的图表、信号通路图和图形摘要。通过将文字描述、手绘草图或参考图片转换为高分辨率可视化内容,该平台消除了对复杂设计技能的需求,使科学家能够专注于研究本身,不需要手工绘图了。https://www.scidrawer.com

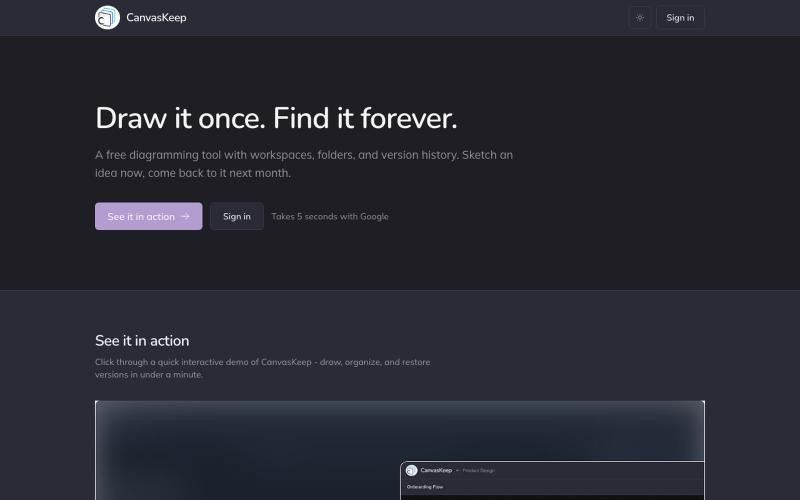
A free diagramming tool with workspaces, folders, and version history. Sketch an idea now, come back to it next month.
@_aniruddha_d · X