
生产力3 weeks ago
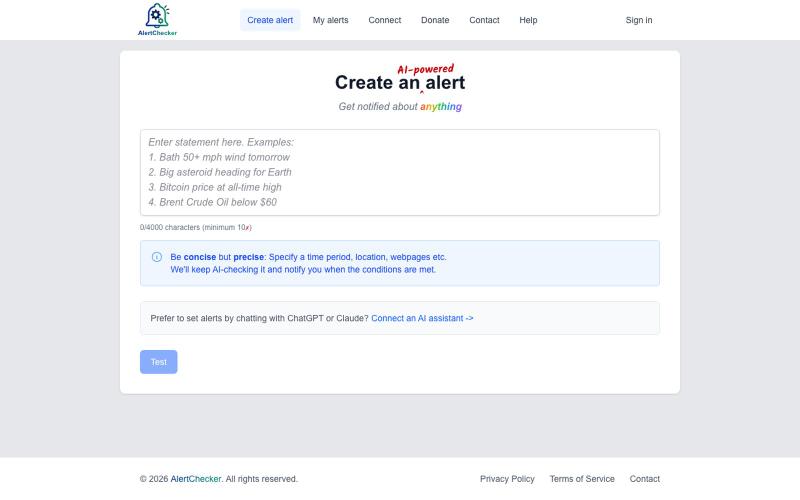
Website Change Alerts, Price Drop & Stock Availability Monitoring | AlertChecker
用纯英文设置监控,当价格下降或网站更新时自动收到提醒。
alertchecker · HN
AlertChecker – get emailed when a plain-English statement comes true
完整作品展
技术栈
60 projects
用纯英文设置监控,当价格下降或网站更新时自动收到提醒。
alertchecker · HN
AlertChecker – get emailed when a plain-English statement comes true
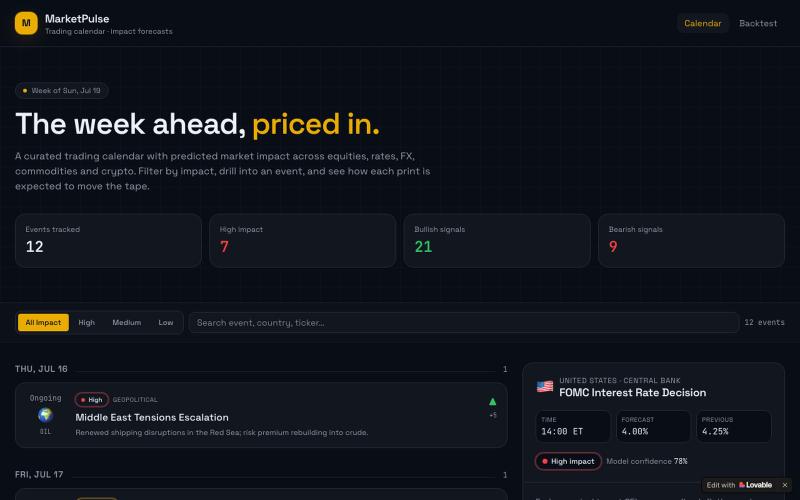
基于AI的经济日历,预测股票、外汇、债券、大宗商品和加密货币的市场影响。

@yumbedinho20962 · X
Check out what I just built with Lovable!
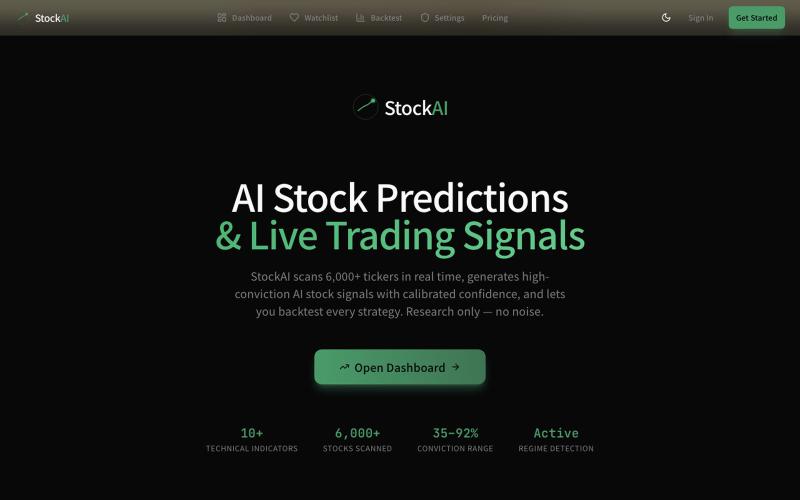
StockAI是AI驱动的股票预测和信号工具,支持回测和模拟交易。

@useStockAI · X
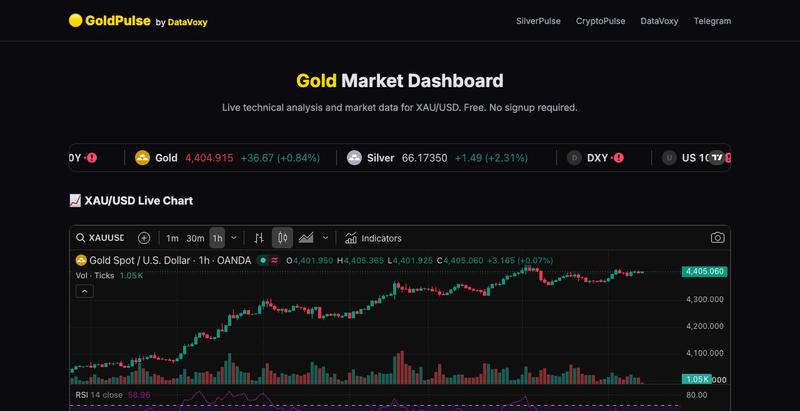
GoldPulse:追踪实时黄金价格,分析技术指标与支阻力位。

@DataVoxy · X
Just shipped: a live gold market dashboard that auto-updates every 15 min. Built with Python + Cloudflare Workers + R2. Zero cost to run. More tools coming. Building in public.
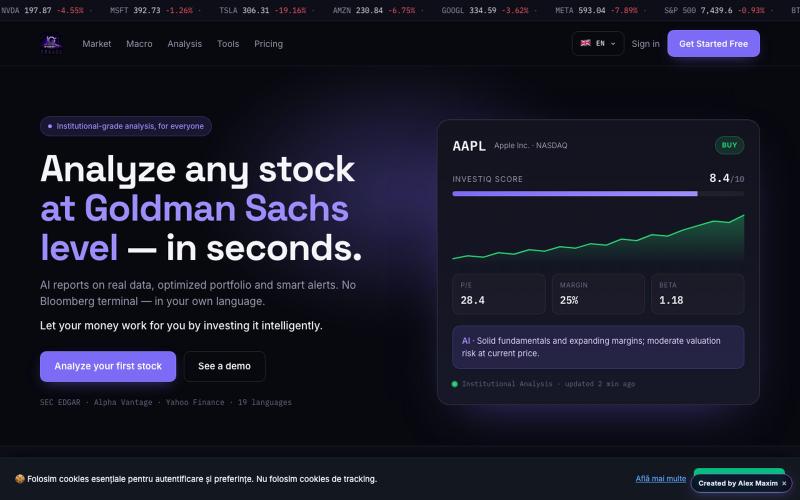
用AI分析股票,获得投资组合优化建议和实时提醒。

@AMaxim62228 · X
Check out what I just built with Lovable!
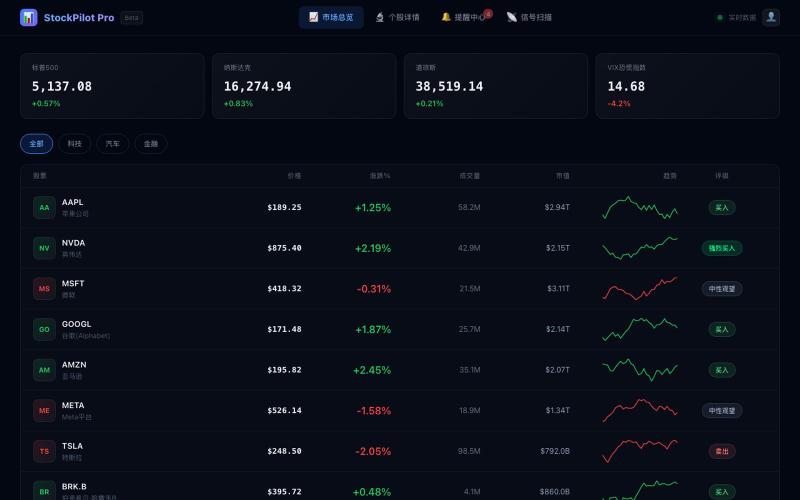
美股交易信号平台,分析市场数据识别交易机会。

@MEJ50749 · X
用 @dappOS_com coding 做了一个美股信号网站: 它和普通美股行情网站最大的区别是:普通网站更多是“给你看行情”,而这个网站更像一个“辅助交易工作台”。 大多数美股网站会把价格、涨跌幅、新闻、财报、K 线分散展示出来,信息很多,但用户还要自己判断: 哪只股票值得看? 现在是什么信号? 这个信号强不强? 有没有触发提醒? 后续要不要复盘? 我这个站的核心思路不是堆信息,而是把交易前的观察流程做成工具: 1. 市场总览不是单纯看涨跌 首页会把美股标的放进观察池里,比如 AAPL、NVDA、MSFT、GOOGL、AMZN、META、TSLA 等,不只是显示价格,还会结合涨跌幅、成交量、市值、PE/PB、行业、52 周区间等信息,让我先快速判断哪些票值得继续看。 2. 最重要的是信号扫描器 这个功能是普通行情站很少直接做成工作流的地方。 网站里有“智能信号扫描器”,可以扫描技术形态,并把信号归类成突破、反转、动量、超卖、超买、金叉、死叉、背离等类型。 比如: NVDA 出现强势突破、量能放大、均线多头排列; AAPL 出现 MACD 金叉、RSI 超卖反弹、布林带下轨支撑; MSFT 出现 MACD 背离,需要注意短期回调; TSLA 出现均线死叉,提示中期下行压力。 这就不是简单告诉我“今天涨了多少”,而是帮我回答一个更交易化的问题: 这只股票现在为什么值得关注,关注点在哪里? 3. 个股详情页更像交易前检查清单 普通网站的个股页往往是行情 + 新闻 + 财务数据。 我这个站的个股详情页更偏“交易前判断”:价格、评级、52 周区间、K 线/成交量、基本面、技术信号、资讯都放在一起。 它的价值是把“发现信号”之后的下一步接住。 扫描器告诉我哪只票有异动,详情页帮我进一步看这个信号有没有质量。 4. 提醒中心是我最喜欢的功能 这个站不是看完就结束,而是有 Alerts Center。 里面可以看到全部提醒、已触发提醒、等待中提醒,还能新建价格/信号提醒。 比如: NVDA 突破 900 美元触发提醒; AAPL 出现 MACD 金叉提醒; TSLA 等待成交量异常触发; META 跌破支撑提醒止损风险; AMZN 突破近期高点提醒动能增强。 这和普通美股网站最大的差异就在这里: 它不只是信息展示,而是把“观察 →
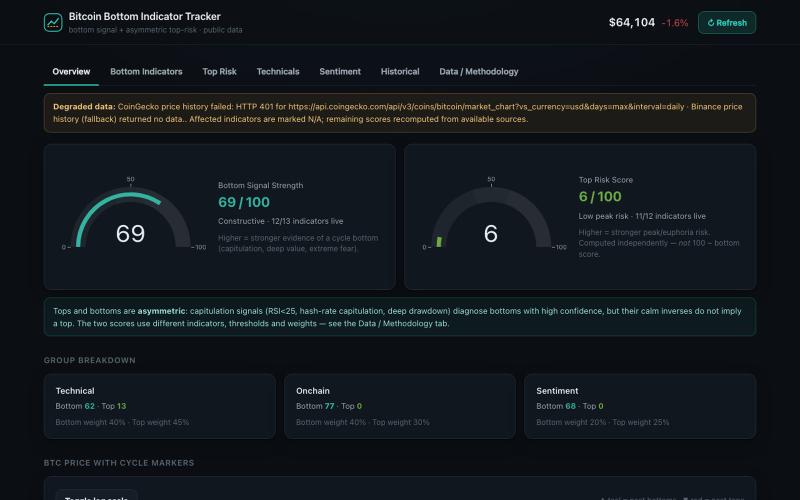
查看 Bitcoin 底部和顶部风险信号,来自综合技术、链上和情绪指标。

@BDNcontent · X
Every post in my LinkedIn timeline is about one of two things right now: 1) Github is the new necessity for marketers, and 2) Substack integrated Pangram to "combat AI slop." The first one is kind of cool, I made my own Github this week to publish the first tool I vibe coded on my own. The second one is kind of annoying because while some people already know AI detectors are almost useless, some are also hailing Substack as being forward-thinking and righteous for bringing down the big bad AI sloppers. What Substack did boils down to a marketing ploy. The hot trend in advertising/marketing right now is being anti-AI because a lot of people are sick of AI slop, understandably. But Pangram isn't a fix for anything other than the most generic one-prompt outputs, i.e., someone goes to ChatGPT and says "write me a long-form newsletter," and they copy + paste the output. That will obviously be flagged. If someone has a custom project or GPT they trained extensively,
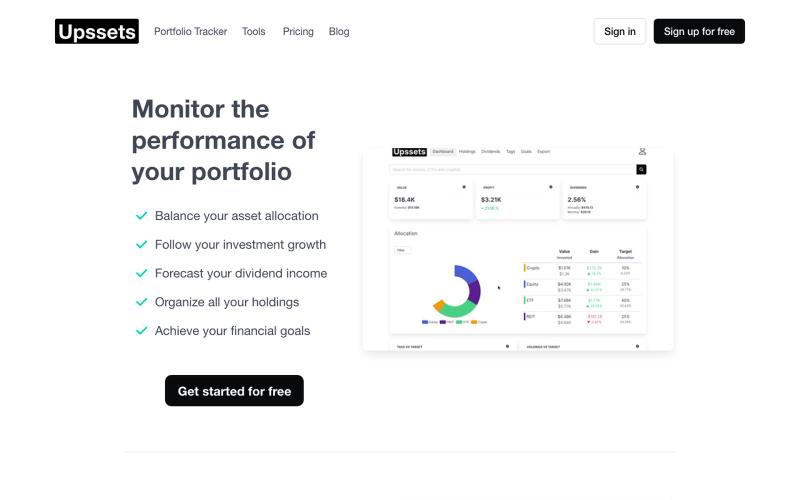
Upssets让您追踪股票、ETFs、REITs和加密货币投资组合,获取股息预测和再平衡建议。

@silverw_dot_ing · X
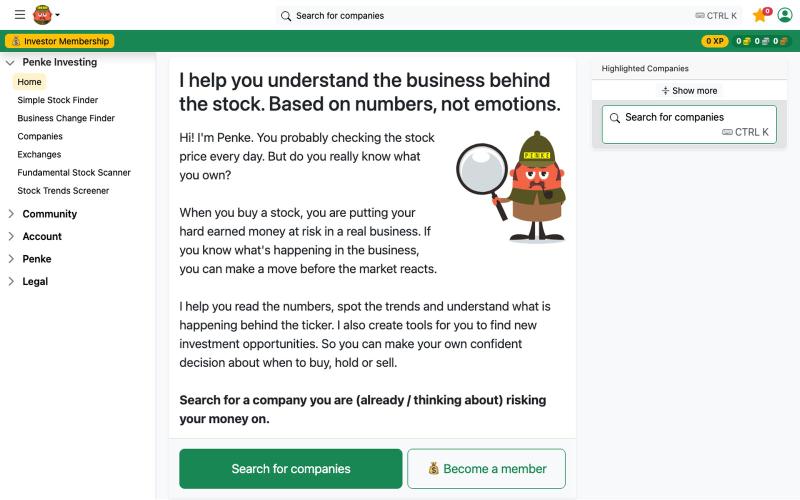
You probably checking the stock price every day. But do you really know what you own? — Penke 🥸

@PenkeInvesting · X
if you have an high MRR you prob wanna invest it... make sure you dont lose it and check the business behind the stock first
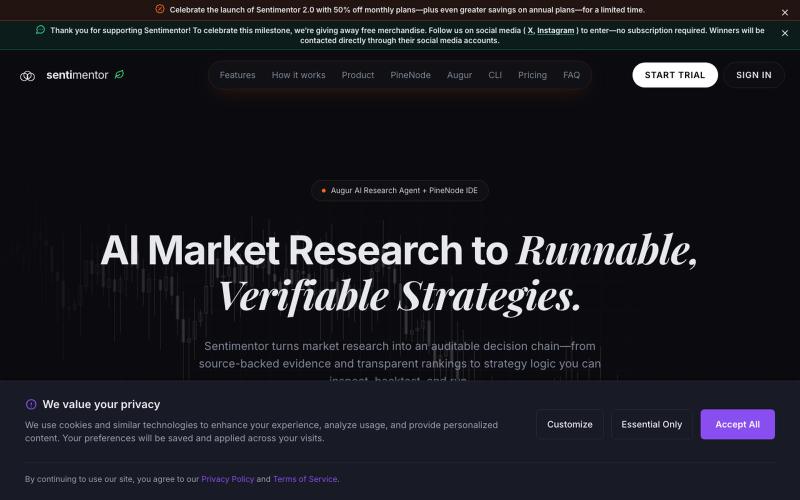
AI驱动的交易研究平台,提供175+指标、多种图表和自动化工作流。
u/sentimentor-ai · Reddit
We rebuilt Sentimentor 2.0 around asking traders what sucks about their market research and trading platform. Greetings Everyone ! Sorry for the long post but I appreciate your time in advance. Back in March 2026, our team launch sentimentor.ai - a market data and sentiment analysis platform. Since then, we have reached out to users from different subreddits asking what is the biggest pain point they have seen in using the platform of their choice. Even though everyone had
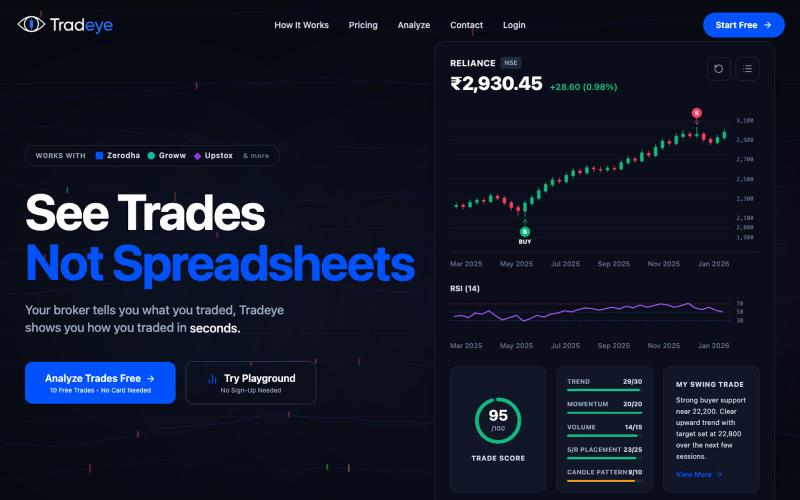
Tradeye, see your trades on the chart. Upload your broker CSV and instantly visualize every trade with AI scoring, technical analysis and plain English insights.

@prathmesh2048 · X
see your trades on actual charts, not just numbers. let's connect.
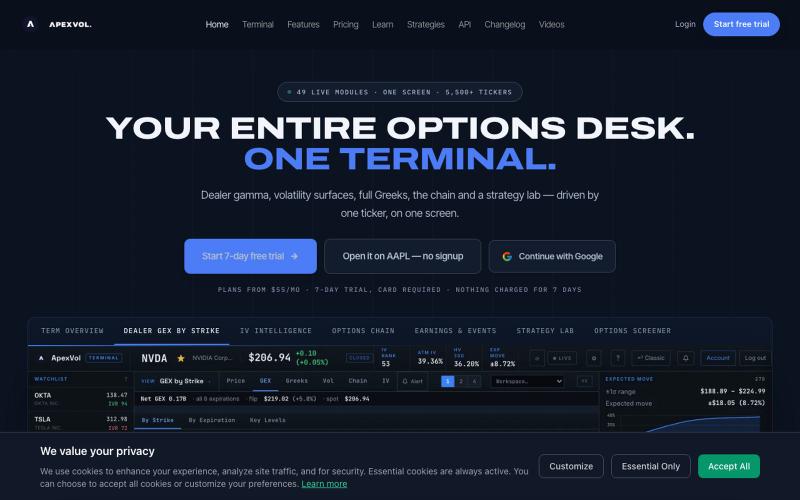
ApexVol 实时期权终端,显示 6000+ 股票的波动率、希腊字母和伽玛敞口。

@apexvol · X
Options are a volatility bet, but price charts can't show you the vol. Our terminal puts the whole surface on one screen: IV rank and percentile, term structure, skew, vol risk premium, dealer gamma and implied earnings moves, across ~6,000 tickers