
创意工具1 week ago
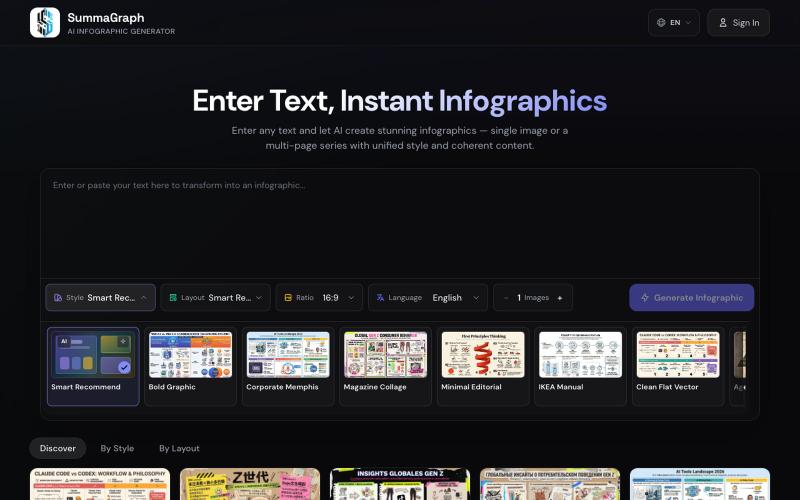
Summagraph: Turn Text into Share-Ready Infographics
Summagraph 用 AI 将文本转换为信息图,提供 17 种风格和 20 种布局选择。
SummaGraph — AI 信息图生成工具,粘贴任意形式的文本即可一键生成高质量信息图,内置 20 种视觉风格 × 20 种布局模板,支持系列模式一次生成多页风格连续的信息图,覆盖中英日韩等 9 种语言
完整作品展
技术栈
60 projects
Summagraph 用 AI 将文本转换为信息图,提供 17 种风格和 20 种布局选择。
SummaGraph — AI 信息图生成工具,粘贴任意形式的文本即可一键生成高质量信息图,内置 20 种视觉风格 × 20 种布局模板,支持系列模式一次生成多页风格连续的信息图,覆盖中英日韩等 9 种语言
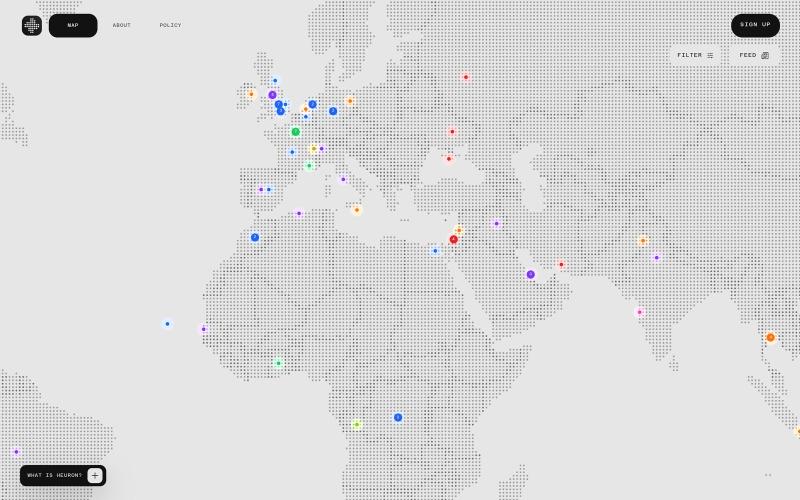
通过可视化、感知来源的新闻地图探索全球事件。

@brryg_ · X
sure man, working on a social and visual news hub called heuron - lmk what you think!
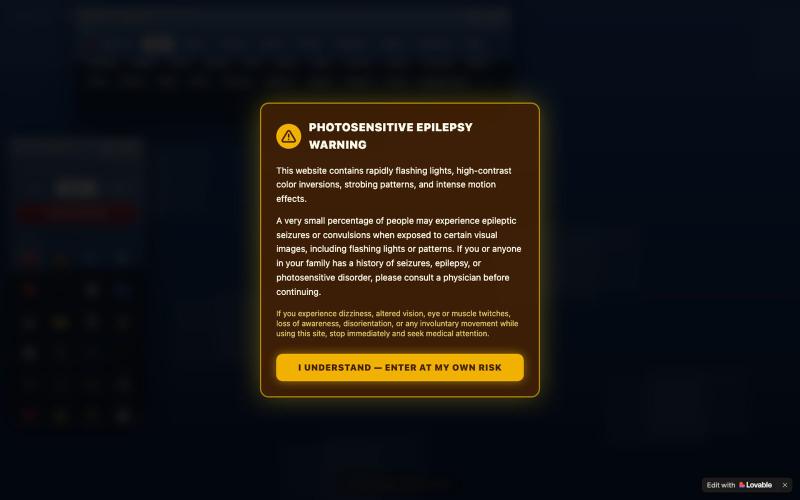
用复古Windows图标绘画,应用故障、反演、隧道、镜像和像素化等视觉效果。

@yarikholk · X
Check out what I just built with Lovable!

用 AI 从文本故事创建网络漫画和漫画,支持多种艺术风格和 4K 导出。
StarVeil AI - 星河入梦 — 使用AI生成连续漫画的网站

Avnac 是一个开源设计工具,可在浏览器中创建图形。

@akinkunmi · X
He trash-talked me and my amazing project ( unprovoked while all his projects are vibe-coded slop. That's why I named him King of Slop.

用文字创建和导出图表,支持 Mermaid、PlantUML、D2 等格式。

@soyalexdzul · X
Open-source platform for creating, organizing, and exporting diagrams using plain text markup. It combines the power of Mermaid, PlantUML, and D2 with a polished interface

Accessibility testing, documentation, and vision/sensory/motor simulation tools. A non-profit initiative: WCAG 2.2 audits with plain-language fixes, built on pour engine.

@A11y_pour · X
One in six people experience the web differently than you think. pour shows you what's getting in the way, and exactly how to fix it.
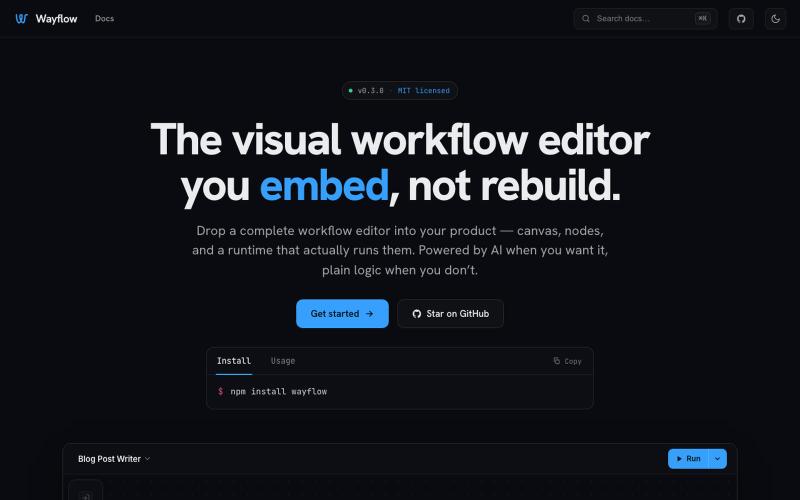
可嵌入的可视化工作流编辑器,支持AI驱动或纯逻辑设计。
tahazsh · HN
Hi! I’m Taha. In many agentic products that support workflows (including one I worked on), I noticed they either don’t support node-based editors, or use React Flow and go through the difficult work of integrating it into their product to run it and work with their existing logic. So I thought about creating a tool that could help with this by closing the gap between the editor and the runtime. That’s why I created Wayflow. The basic architecture is simple: you just need to create a graph (which is a JSON object) that the runtime knows how to run. The runtime doesn’t care where that graph is coming from, it just needs the right schema. And with the help of the editor, you can create the graph, and then export it or directly save it on your backend in your database. And then when you want to execute it, you just hand it to the runtime. The runtime can either stream the execution (which is useful for the editor), or give you the final result. How you execute the graph is up to you: t
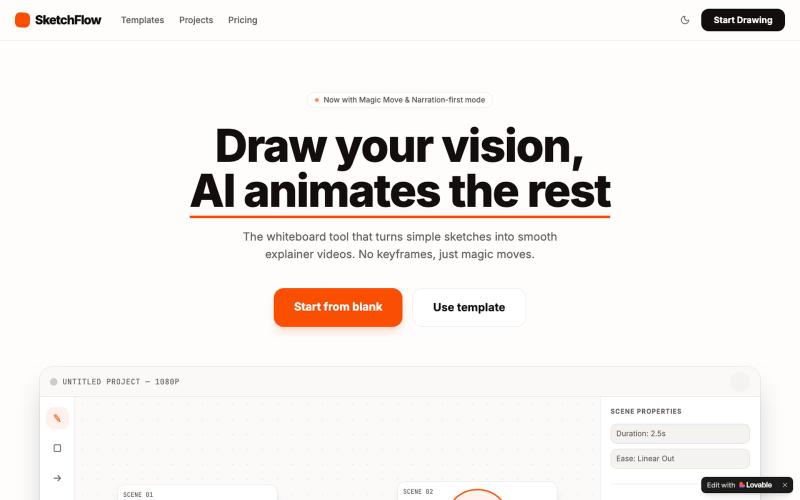
将素描转换为AI辅助动画的解释视频,包含语音旁白。

@berekib · X
Check out what I just built with Lovable!
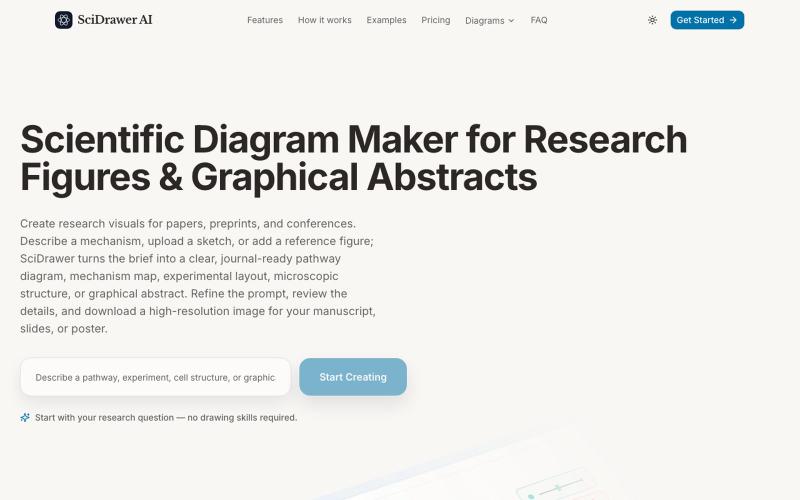
SciDrawer:从文字描述、手绘草图或参考图片生成科学研究图表。
zyrliuwei · V2EX
SciDrawer:基于人工智能的科学图表生成工具 SciDrawer 是一个专为科究人员设计的专业人工智能平台,可帮助他们即时生成符合期刊要求的图表、信号通路图和图形摘要。通过将文字描述、手绘草图或参考图片转换为高分辨率可视化内容,该平台消除了对复杂设计技能的需求,使科学家能够专注于研究本身,不需要手工绘图了。https://www.scidrawer.com

用 Chrome 扩展和网页编辑器将屏幕截图转化为精美设计。

@buildwithshyam · X

在浏览器中压缩、转换和调整图像大小,支持 JPG、PNG、WebP、GIF、AVIF 等。

@VumexaAi · X
Building VUMEXA — free browser tools for small image/file tasks. Current focus: compress images, hit exact KB limits, resize, and convert WebP/JPG. No uploads, no sign-up. Files stay local in the browser.