
创意工具3 weeks ago
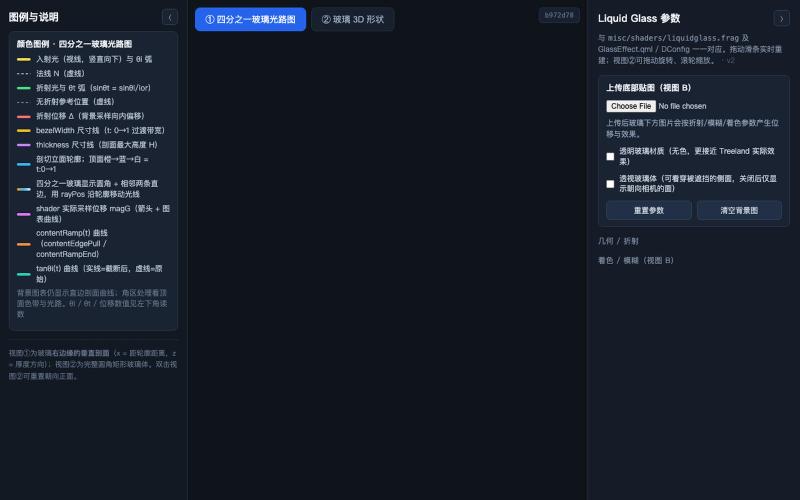
Treeland Liquid Glass · 参数 3D 可视化
交互式 3D 玻璃效果可视化,展示光线折射和参数对外观的影响。

@zccrs · X
做了一个 Liquid Glass 3D 可视化工具 🫧 把玻璃边缘的图像形变从 2D 变成直观的 3D 几何,让你可以直接看到玻璃的形状、光线与折射,以及 radius、thickness、bezel width 等参数对最终效果的影响。 欢迎体验: 🔗
完整作品展
技术栈
71 projects
交互式 3D 玻璃效果可视化,展示光线折射和参数对外观的影响。
@zccrs · X
做了一个 Liquid Glass 3D 可视化工具 🫧 把玻璃边缘的图像形变从 2D 变成直观的 3D 几何,让你可以直接看到玻璃的形状、光线与折射,以及 radius、thickness、bezel width 等参数对最终效果的影响。 欢迎体验: 🔗
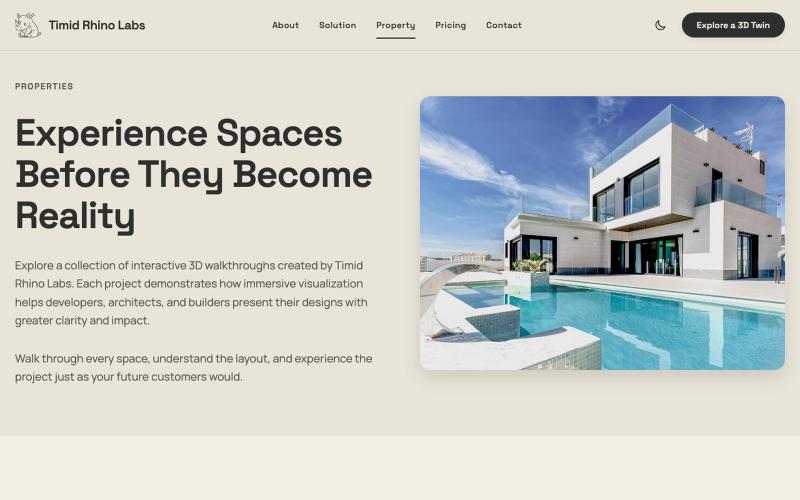
将平面图转为3D虚拟看房工具。

@ShivamMish11788 · X
We've been helping developers and brokers turn floor plans into interactive 3D walkthroughs. Makes it much easier for buyers to visualize the space.
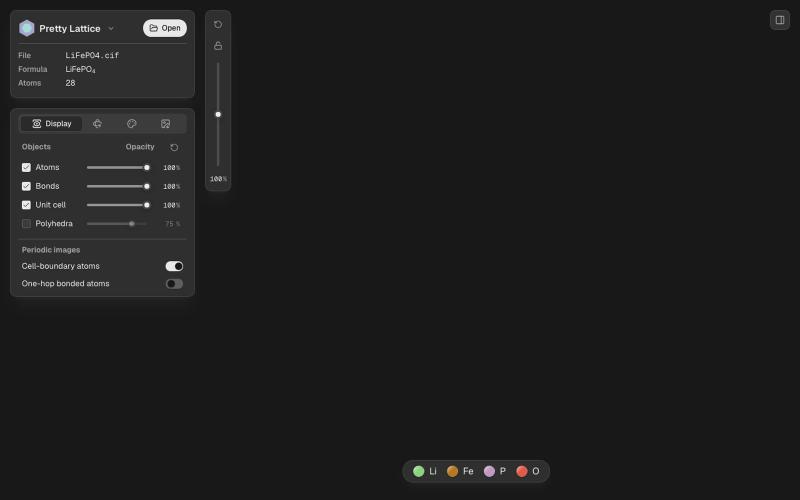
创建美丽的晶体可视化和图案。

@songfeitong · X
Introducing Pretty Lattice, a modern-looking crystal visualization tool for creating beautiful figures. Built with Codex since 5.5, and now with 5.6 sol. A huge leap from 5.5, much better at frond end. Github: Demo:
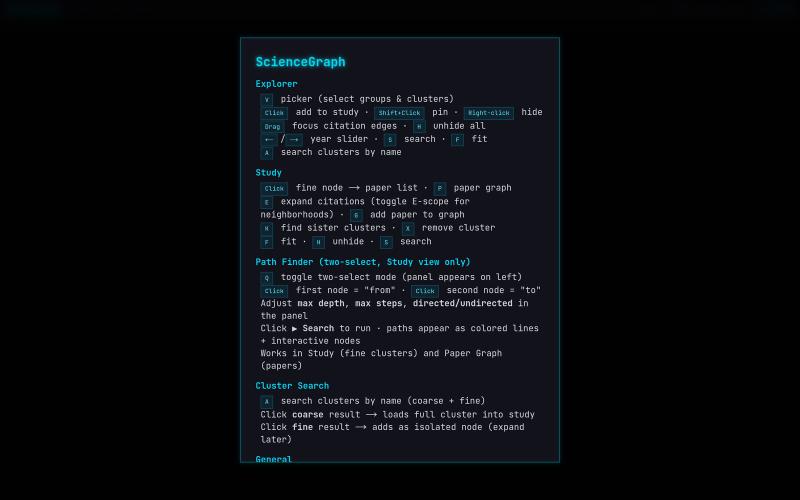
科学引文网络与论文的交互式WebGL可视化。

@lushptr · X
I feel really guilty for vibe coding this but it looks cool even tho it is really inefficient and broken you can use it too now I'll desloppify it after exams I swear

CodeFlovio 将代码转换为交互式流程图,便于学习、调试和文档编制。

@Sparsh209 · X
Hi isha! Check it out here at: Would love to hear your feedbacks
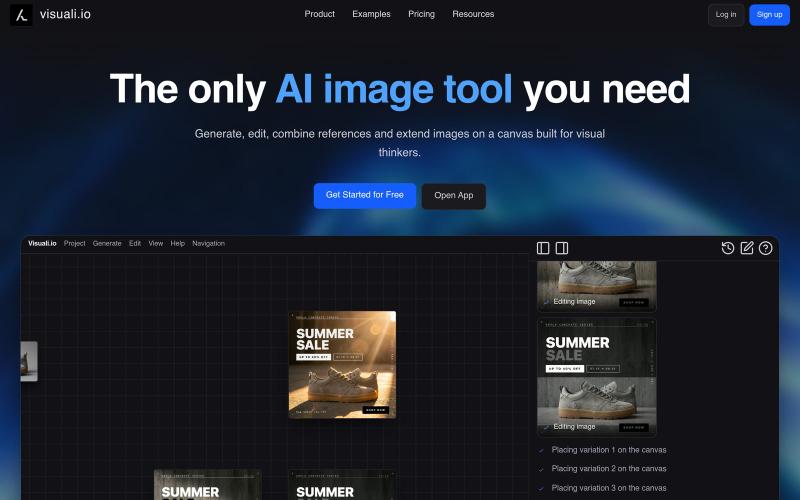
AI 图像编辑与生成工具,在浏览器和移动设备上编辑和扩展图像。
visuali · HN
Like Claude Code for Images
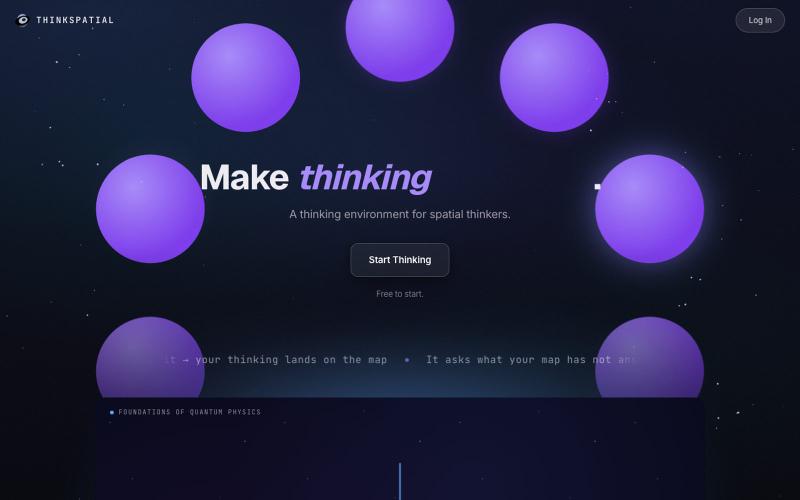
将想法组织为视觉地图,提取关键见解并转化为文档和演讲稿。
u/shadowosa1 · Reddit
I rebuilt my landing page after 300+ visitors still didn’t understand what my app does. I’ve been building a spatial thinking environment called ThinkSpatial, and one of the hardest parts hasn’t been building the product. It’s been explaining what it is in the first few seconds. The basic idea is simple. You speak or type, and your thinking gets turned into a visual map instead of disappearing into a chat box, doc, or note-taking app. My first landing page was way too focused on showing h

用AI驱动的审计工具分析系统,包含多个版本。

@jozef_x1 · X
🚨 I Vibe Coded F0ur (4) different versions of @coreyganim's "Ai Audit" Funnel, which is your favourite? VERSION #3:
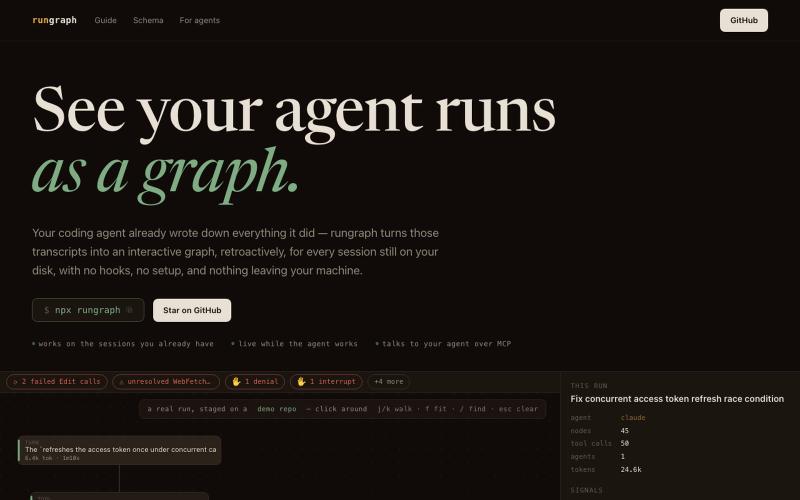
将 AI 编码代理的运行转录可视化为交互式图表。
u/Express-Phase1532 · Reddit
rungraph - see what your coding agent actually did, as an interactive graph (open source) My coding agent kept doing 20 minutes of work I couldn't inspect afterward. The transcript exists (Claude Code and Codex CLI write everything to disk), but nobody reads 4,000 lines of JSON. So I built rungraph, open source and free (MIT). npx rungraph turns every session on your machine into a clickable graph: your prompts run down the spine, subagents get their own lanes, and it flags stuff like ret
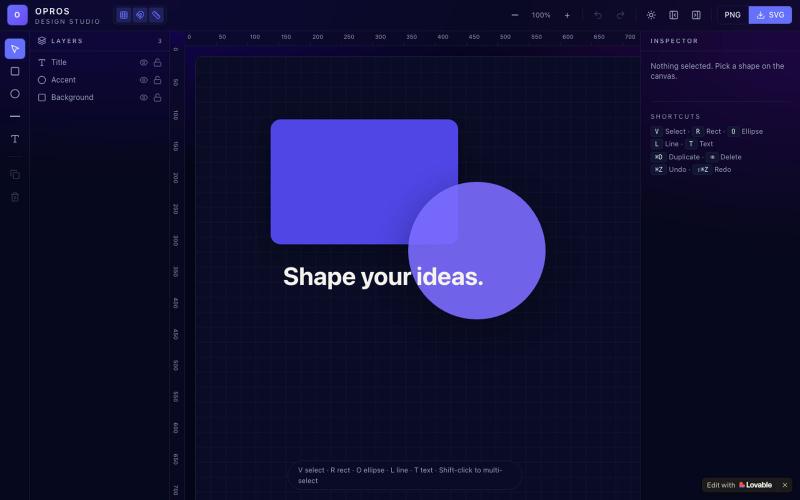
在网络上创建和可视化设计的创意工作室OPROS Design Studio。

@OprosOlamiflex · X
Check out what I just built with Lovable!
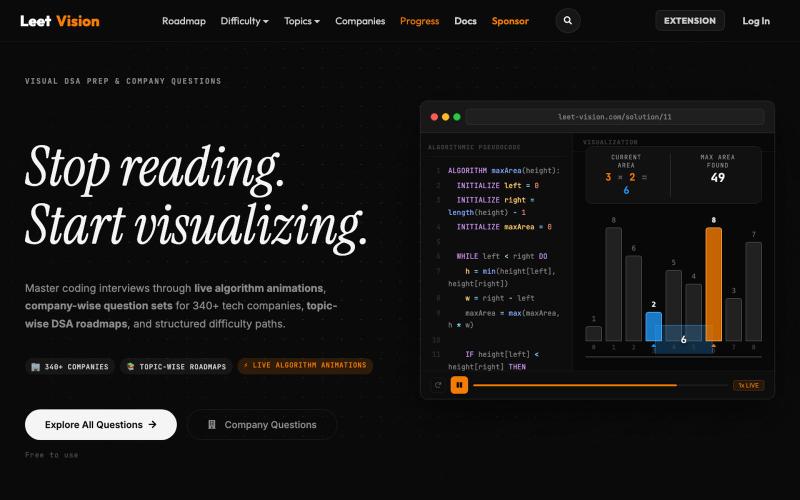
The ultimate LeetCode helper and visualizer. Master Data Structures and Algorithms with step-by-step visual solutions and structured interview roadmaps.

@vishwesh_shinde · X

React 和 shadcn/ui components,用于在营销和登陆页面上创建 animated visual elements

@pixelcave_john · X
Hey Germán! I recently launched and a major update to Tailkit!