
教育学习1 month ago
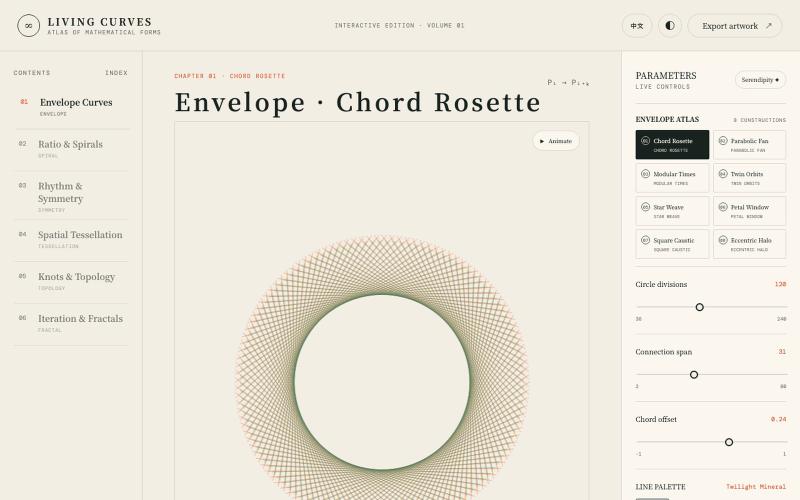
Atlas of Living Curves
探索数学曲线、分形、对称和拓扑的交互式可视化。

@vkuoo · X
Added more demos showcasing graph-math relationships, built with Codex.
完整作品展
技术栈
31 projects
探索数学曲线、分形、对称和拓扑的交互式可视化。
@vkuoo · X
Added more demos showcasing graph-math relationships, built with Codex.
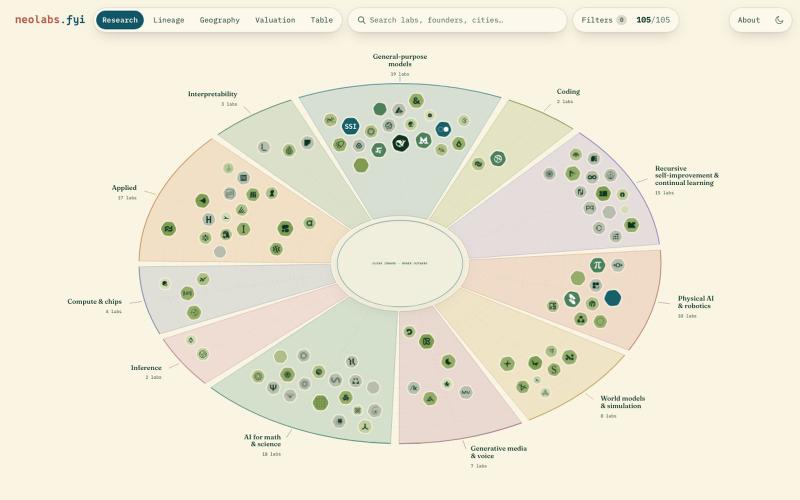
AI实验室交互式地图,按估值、地域和研究方向可视化展示。
polyphilz · HN
Neolabs.fyi – 100 new AI labs by research area, valuation, and more
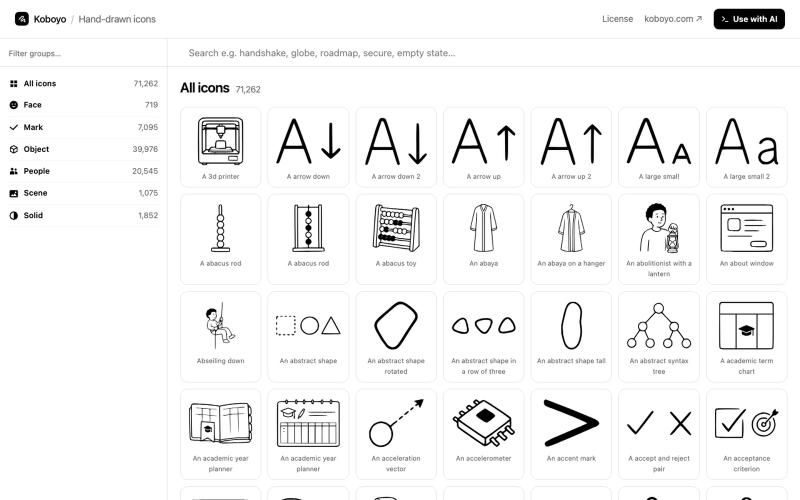
搜索并下载71,262个免费手绘SVG图标,支持同义词匹配。
kamranahmedse · HN
I made 70K+ hand-drawn icons using AI

聚合所有链接到一个页面,含二维码和实时统计

@interchained · X
one handle, every surface

@lightsilver323 https://t.co/YIvqjGR5Wv

@dogabot · X
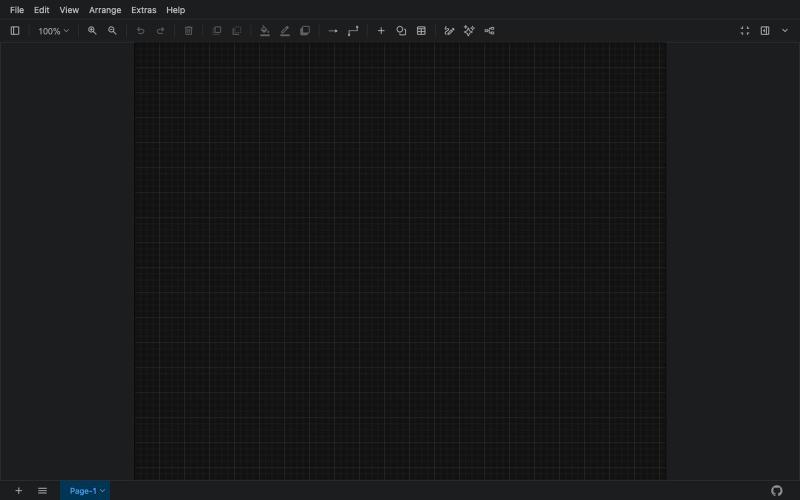
创建流程图、程序图、组织架构和UML图的免费在线工具。

@N0V4Dev · X
I found a tool called Next AI that links AI capabilities directly with diagrams. It lets you build and edit diagrams using natural language prompts instead of clicking around the canvas manually. It's a handy way to sketch out architecture when you don't want to drag every box yourself. The project is built on TypeScript with React 19 and Next.js. It supports multiple AI providers and even includes an MCP Server. This means you can use it with the Claude Code CLI to generate diagrams from your terminal. Deployment options are flexible too. You can run the tool locally with Docker or push it to Vercel and Cloudflare Workers. It supports multi provider setups so you can pick the backend that fits your workflow. #Nextjs #AI #Diagrams #TypeScript
