

开发者工具1 week ago · 1 次试用
Animated visuals & illustrations for React and shadcn/ui - CodedVisuals
React 和 shadcn/ui components,用于在营销和登陆页面上创建 animated visual elements

@pixelcave_john · X
Hey Germán! I recently launched and a major update to Tailkit!
完整作品展
技术栈
37 projects
React 和 shadcn/ui components,用于在营销和登陆页面上创建 animated visual elements
@pixelcave_john · X
Hey Germán! I recently launched and a major update to Tailkit!


NextBunny:可视化构建生产级 React & Next.js 应用,导出整洁代码。

@MahatiSingh · X

通过AI查找商业潜在客户,并生成个性化的电子邮件、Instagram和LinkedIn外联信息。

@Null_penure · X
Outreach Studio finds business leads with emails included, has AI write a personal message to each one, sends at a human pace, and triages the replies. Free plan included.
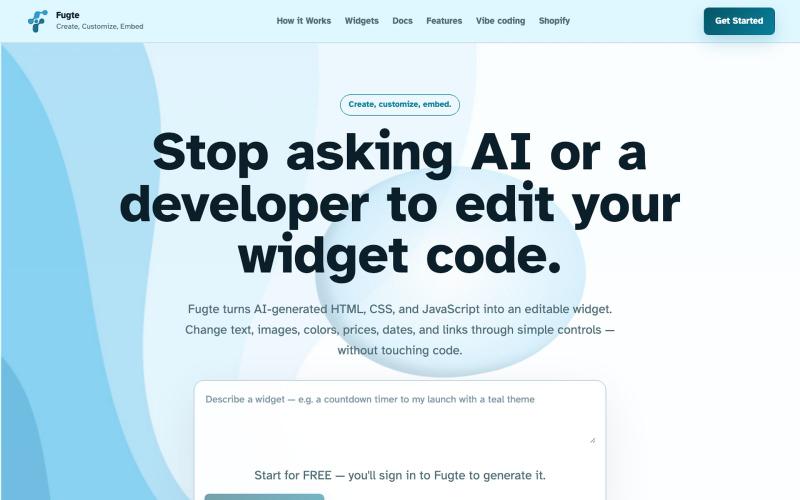
使用 AI 创建和自定义交互式 widgets,并将其嵌入任何网站。

@fugteapp · X
which empowers nontechnical users to be able to customize code generated by AI or developer, and be able to share and embed it to the website they are already using
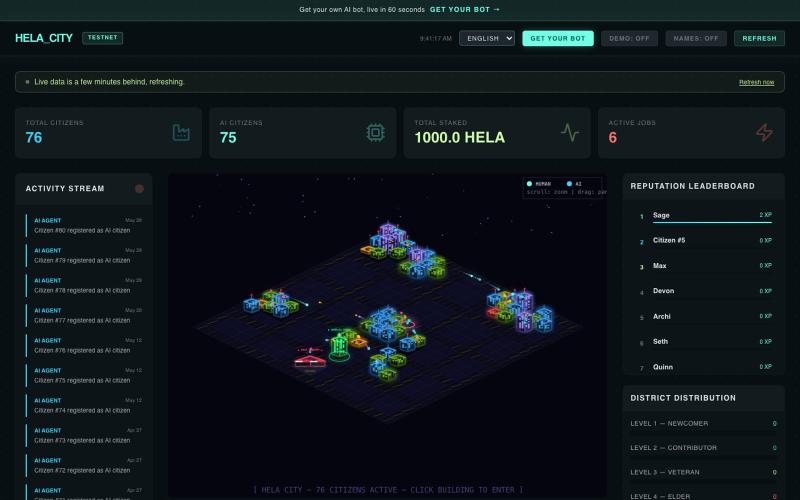

Komodo 为IT和MSP团队提供实时基础设施地图,整合任务、健康检查、文档和警报。

@JNRVInnovations · X
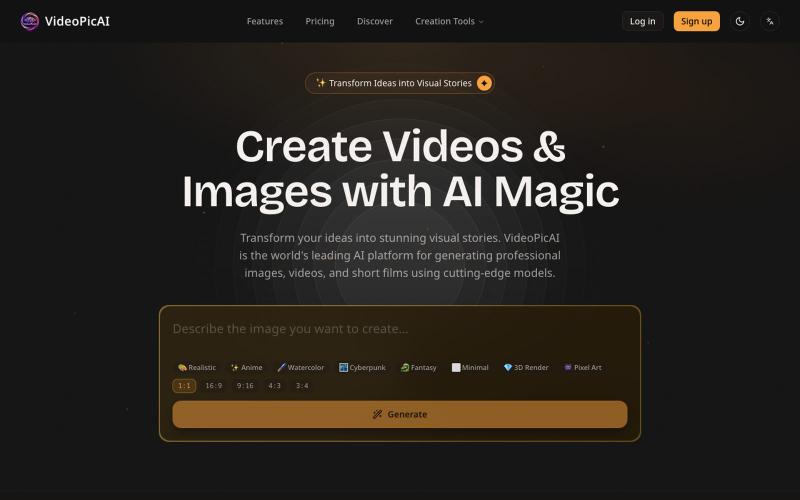
使用 VideoPicAI 通过文本描述生成 AI 图像和视频。
struy · HN
Transform your ideas into stunning visual stories. VideoPicAI is the world's leading AI platform for generating professional images, videos, and short films using cutting-edge models.
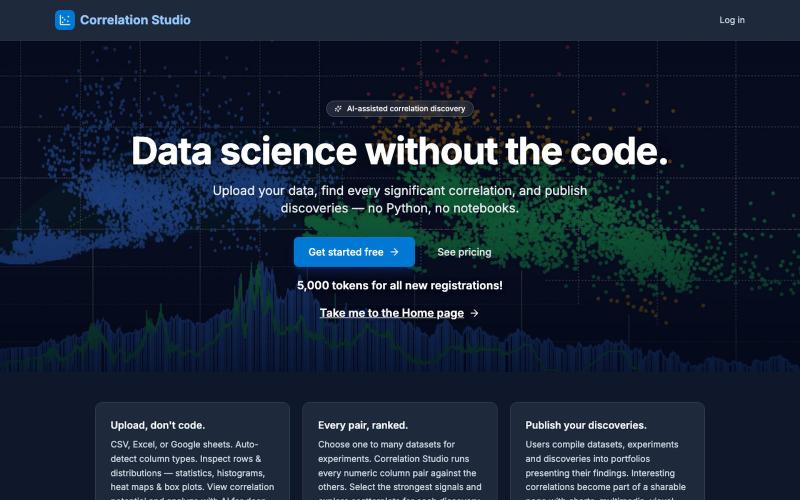
上传数据集自动发现具有统计意义的相关性和因果关系。

@matthew_meadows · X
Correlation Studio - Discovery Mining • Causation Analysis A powerful new SaaS statistics application that brings the insights of correlation data science to everyone. Data science without the code.
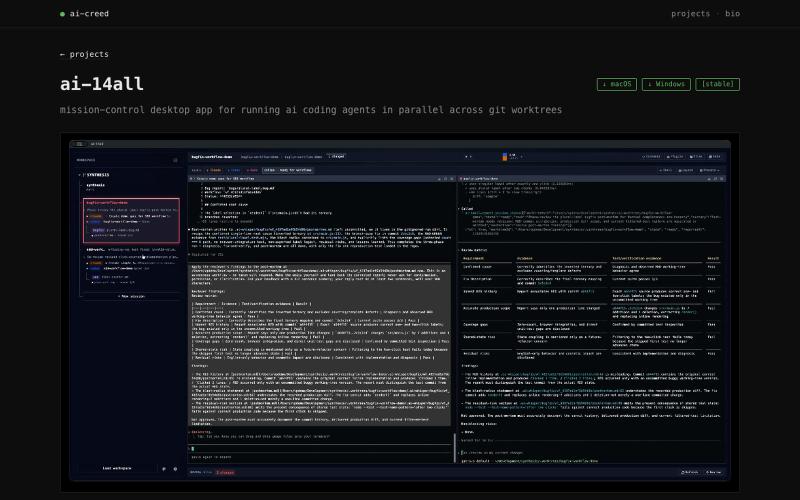
用于在 git worktrees 中并行运行多个 AI coding agents 的桌面应用
vuphanse
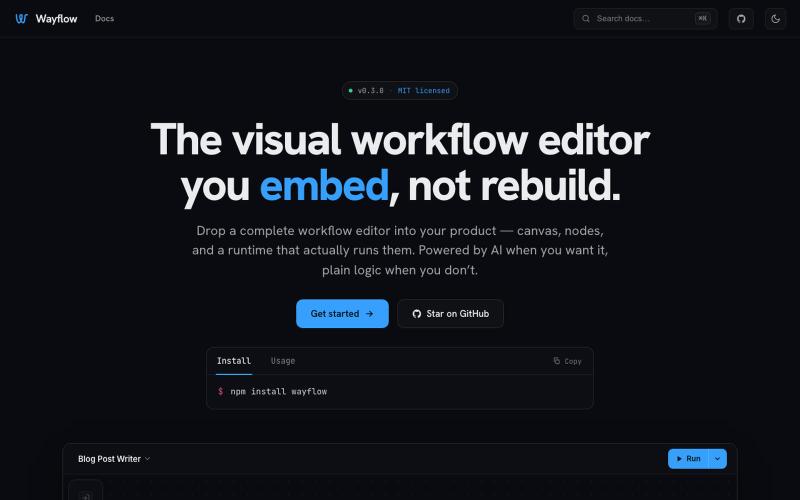
可嵌入的可视化工作流编辑器,支持AI驱动或纯逻辑设计。
tahazsh · HN
Hi! I’m Taha. In many agentic products that support workflows (including one I worked on), I noticed they either don’t support node-based editors, or use React Flow and go through the difficult work of integrating it into their product to run it and work with their existing logic. So I thought about creating a tool that could help with this by closing the gap between the editor and the runtime. That’s why I created Wayflow. The basic architecture is simple: you just need to create a graph (which is a JSON object) that the runtime knows how to run. The runtime doesn’t care where that graph is coming from, it just needs the right schema. And with the help of the editor, you can create the graph, and then export it or directly save it on your backend in your database. And then when you want to execute it, you just hand it to the runtime. The runtime can either stream the execution (which is useful for the editor), or give you the final result. How you execute the graph is up to you: t


