
教育学习1 month ago
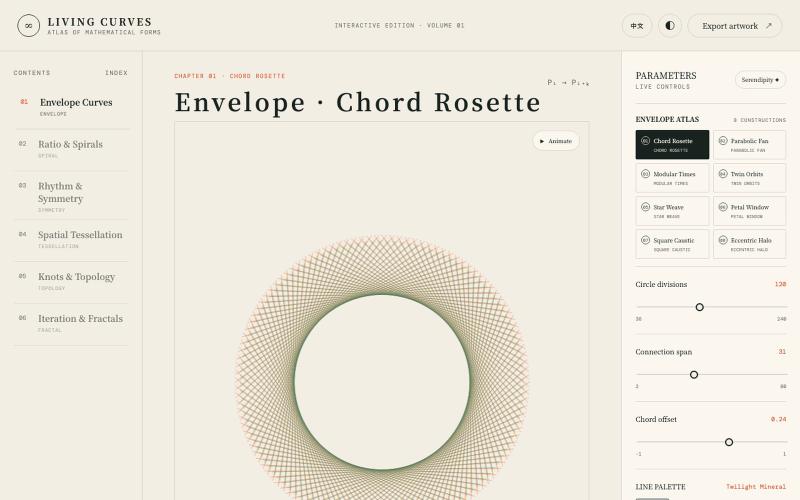
Atlas of Living Curves
探索数学曲线、分形、对称和拓扑的交互式可视化。

@vkuoo · X
Added more demos showcasing graph-math relationships, built with Codex.
完整作品展
技术栈
60 projects
探索数学曲线、分形、对称和拓扑的交互式可视化。
@vkuoo · X
Added more demos showcasing graph-math relationships, built with Codex.
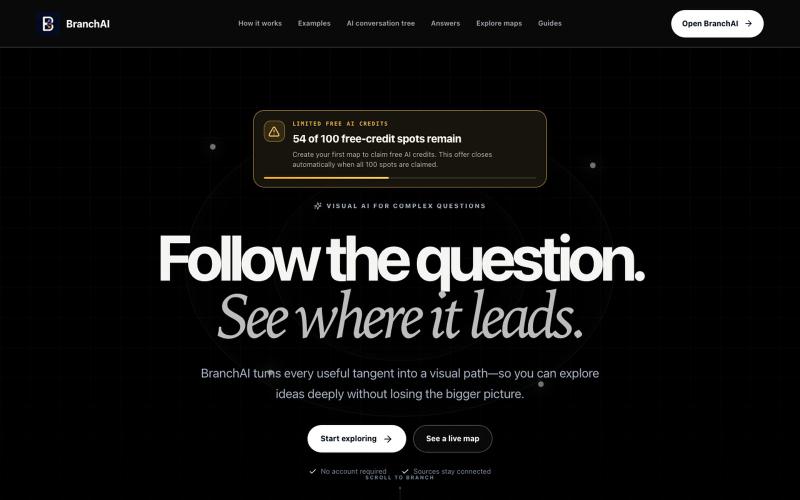
将复杂问题转化为可视化分支知识图谱,深入理解话题。
u/LeonHelloWorld · Reddit
Build update: testing whether visual AI maps are actually clearer than chat This week I finished a public beta of BranchAI, a web app that turns a complex question into a visual tree instead of a single long AI conversation. The hypothesis is simple: people lose useful context once a chat has several follow-ups. Keeping those follow-ups visible as branches should make research and complicated topics easier to revisit. What is working now: - Generate a starting map from a question - Op
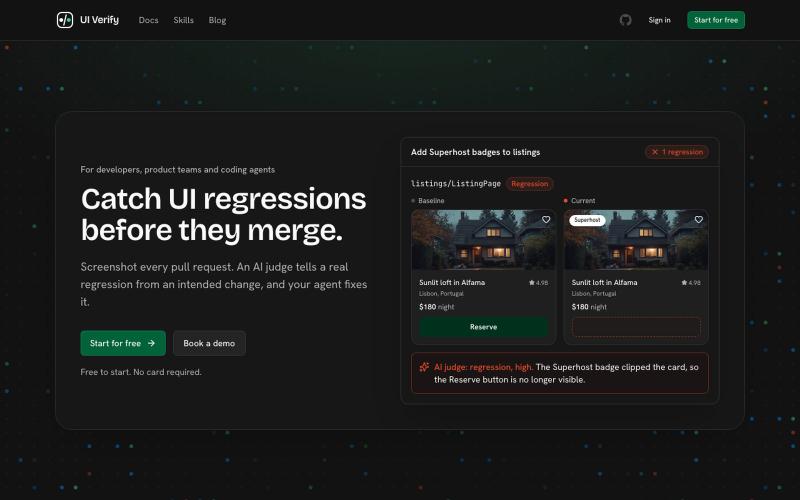
UI Verify - AI驱动的可视化测试工具,区分预期改动和真实缺陷。

@igorluchenkov · X
Hey Yuhao! Been running a lot of agents while building UI and built a tool for visual testing that integrates nicely with agents and gives your agent a way to make sure it didn't introduce any UI regressions:
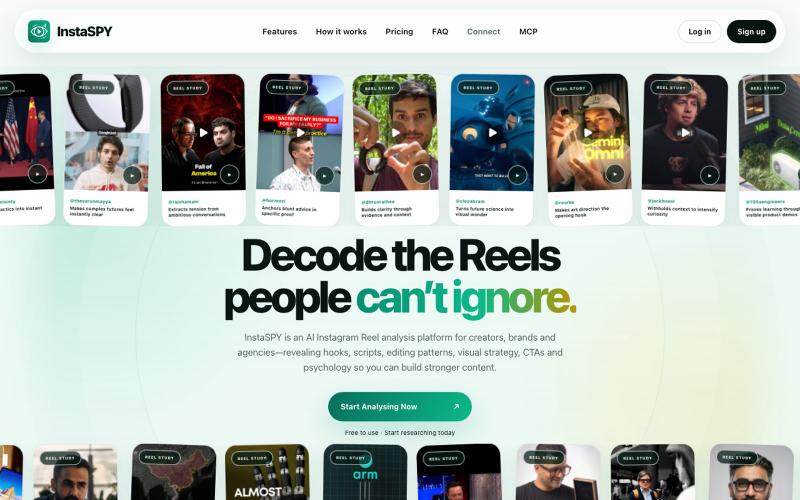
InstaSPY analyzes public Instagram Reels to reveal hooks, scripts, editing patterns, visual strategy, CTAs and psychology for stronger content.

@aixenova · X
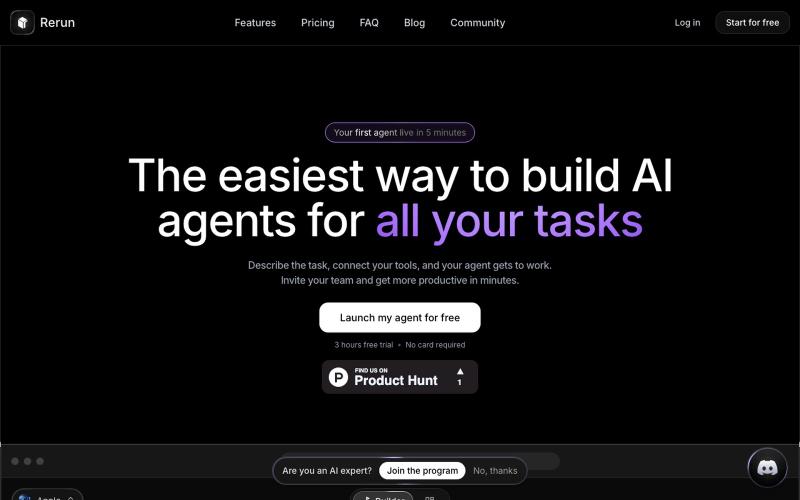
构建AI智能体并在交互式仪表板上实时可视化其执行。

@Aurelsuuu · X
this is my product, come take a look:
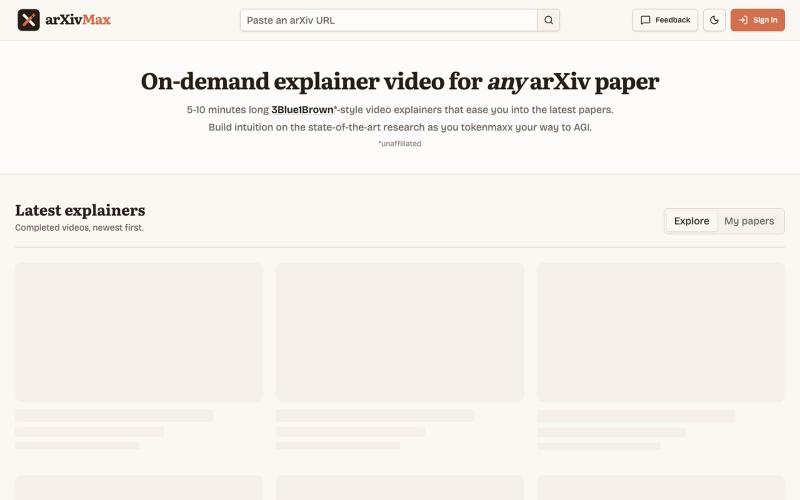
arXivMax – AI生成的学术论文视频讲解平台
rwu1997 · HN
ArXivMax – video explainers for any research paper
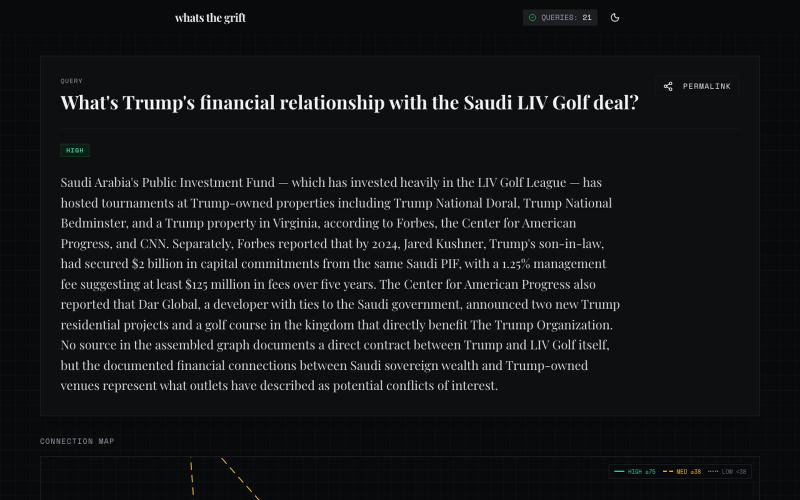
用 RAG 技术研究调查最新的诈骗骗局。
u/King_Kazma · Reddit
whatsthegrift.com - a RAG research tool for today's grifters every day i feel like there's a new grift attached with some news article, which naturally birthed the idea to built something to investigate & visualize them examples: https://whatsthegrift.com/q/777063a64e512565 https://whatsthegrift.com/q/e5945d20375ed3ff and my personal favorite so far: https://whatsthegrift.com/q/f43eb30a15342d53 react (vite) + node (fastify) + brave search (retrieval) + claude haiku (extraction)

Flint是为AI代理设计的可视化语言,用于创建交互式数据可视化。
chenglong-hn · HN
Data visualizations are the bridge between user and data. But building AI agents that can generate visualizations reliably can be very tricky: - simple chart specs can be reliable, but generated charts are often of low quality due to reliance on system defaults; - complex chart specs with explicit details can produce good-looking charts, but they are verbose and agents can struggle with reliability We figured out it is a limitation on the language issue (not just AI capability thing) -- current visualization languages are a bit too low-level for AI agents, requiring them to explicitly make visual decisions that are supposed to be handled by a good compiler. Flint is a visualization intermediate language to address this issue, allow AI agents to solve this last-mile human-agent interaction problem. It provides a simple semantic-type based specification, and contains a layout optimization engine that can produce good-looking charts (filled with derived low-level details) from simple
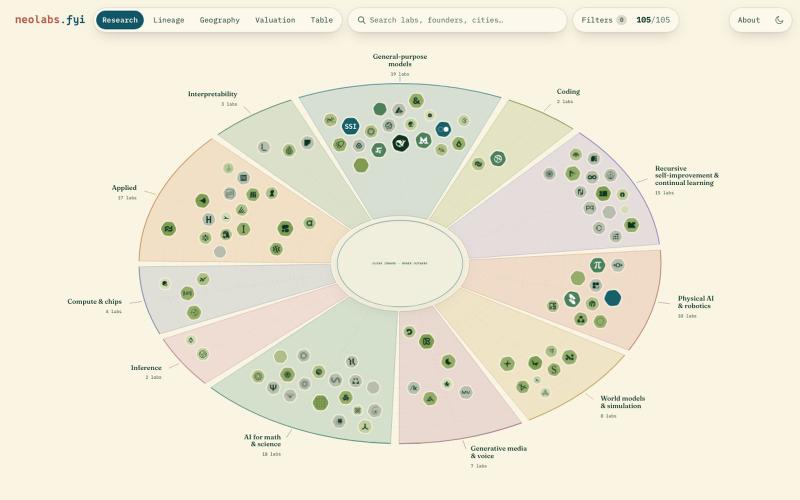
AI实验室交互式地图,按估值、地域和研究方向可视化展示。
polyphilz · HN
Neolabs.fyi – 100 new AI labs by research area, valuation, and more
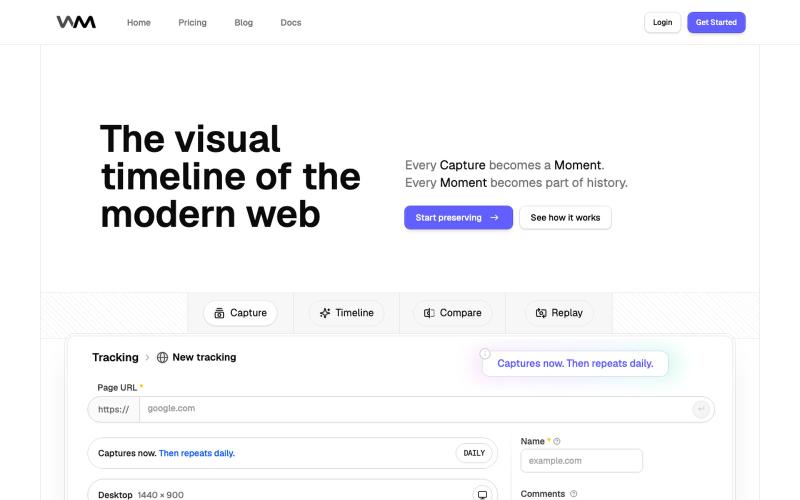
WebMoment - 记录并回放网站在任何时刻的外观。

@WebMomentApp · X
Dropping here, for saving how websites looked before the next redesign changes everything: @WebMomentApp
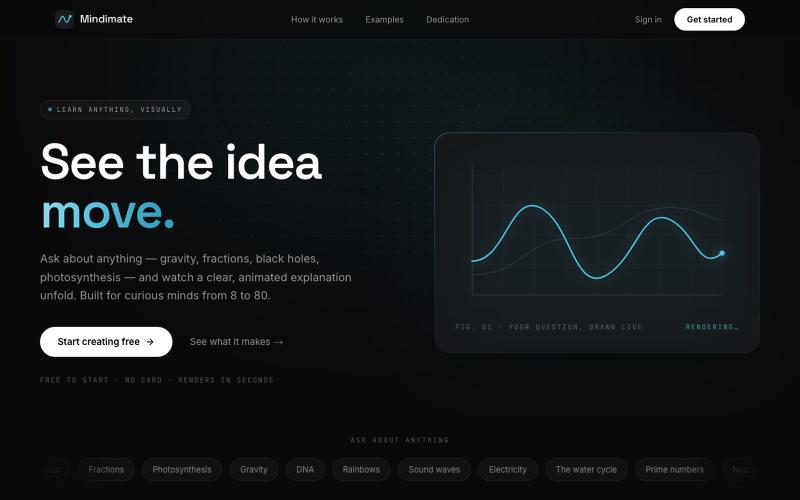
Ask any question — from “why is the sky blue?” to how neural networks learn — and watch a clear, animated explanation. Visual learning for curious minds of every age. Free to start

@Amriith916 · X
Your path to wisdom
搜索实验室报告验证产品纯度和成分。

@Titratelab · X
Love the direction. Partner with us at Built by security & software engineers. We scrape Whatsapp, TG, GLP1forums, Meso, Finnrick, Janoshik, Freedom, peptidechat, and even Discord- where we have over 1 billion messaged logged and analyzed. 70,000 COAs stored in our database from thousands of vendors. Sentimental analysis driven trust signals on all communities. This isn't vibe-coded one-shot scraping; we've developed our own inhouse anti-automation bypasses for nearly every major platform.